Fig. 6
Download original image
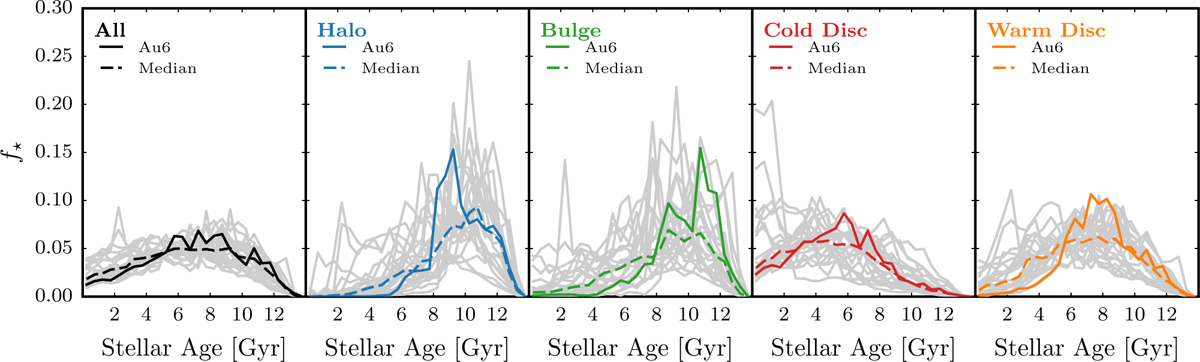
Fraction of the stars with a given stellar age in Gyr at z = 0. Each panel shows the distribution for a given galactic component, normalised to the amount of the stars in that component. The panel on the left shows the distribution of all stars in the galaxy, normalised to the total number of stars. In each panel, we highlight Au6 and the median of the sample.
Current usage metrics show cumulative count of Article Views (full-text article views including HTML views, PDF and ePub downloads, according to the available data) and Abstracts Views on Vision4Press platform.
Data correspond to usage on the plateform after 2015. The current usage metrics is available 48-96 hours after online publication and is updated daily on week days.
Initial download of the metrics may take a while.