Fig. 7
Download original image
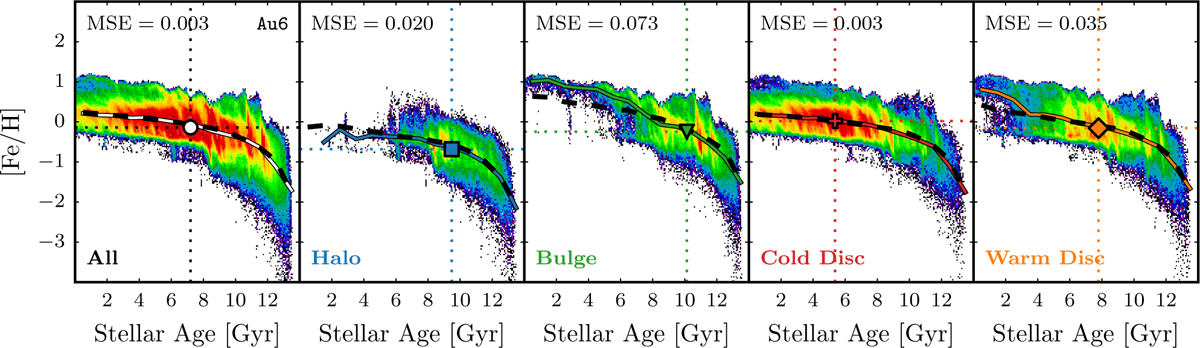
Age-metallicity relation for the stars of Au6 at z = 0. In the x-axis we indicate the stellar age in Gyr and in the y-axis we show the [Fe/H] abundance ratio. The colour map indicates the amount of stars in each pixel in a logarithmic scale. Each panel shows the distribution of the stars that belong to a specific galactic component: all galaxy stars (first panel), halo (second panel), bulge (third panel), cold disc (fourth panel), and warm disc (fifth panel). In each panel, the symbol indicates the location of the median. Furthermore, we also indicate the metallicity trend as a function of stellar age for all galaxies in the sample (black dashed line) and the median for Au6 (continuous line, colour-coded according to each component); on the top left, we show the mean squared error between these two lines.
Current usage metrics show cumulative count of Article Views (full-text article views including HTML views, PDF and ePub downloads, according to the available data) and Abstracts Views on Vision4Press platform.
Data correspond to usage on the plateform after 2015. The current usage metrics is available 48-96 hours after online publication and is updated daily on week days.
Initial download of the metrics may take a while.