Fig. 8
Download original image
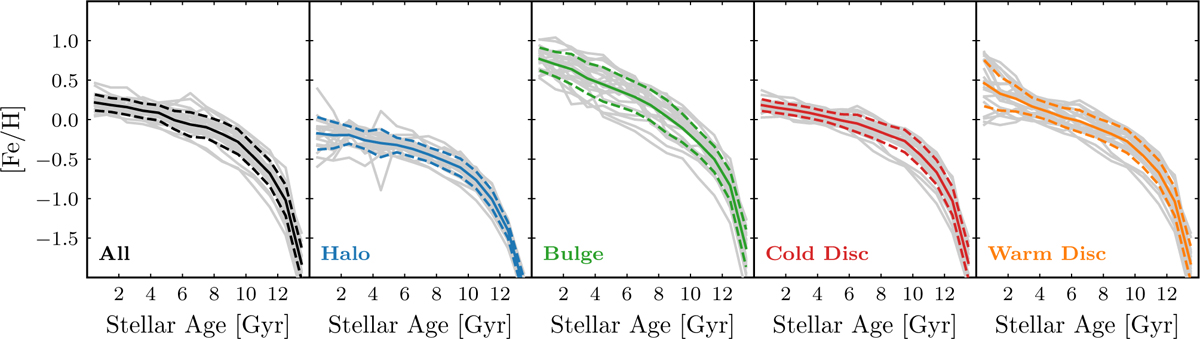
Age-metallicity relation for the Auriga sample. In the y-axis we show the median [Fe/H] metal abundance in each stellar age bin and the panels represent the stars in different components (the panel on the left represents all stars). Grey lines represent the curves for all galaxies in the sample, while the solid coloured line shows the curve for the sample average. The dashed line in each panel shows the ±1 standard deviation of the sample average.
Current usage metrics show cumulative count of Article Views (full-text article views including HTML views, PDF and ePub downloads, according to the available data) and Abstracts Views on Vision4Press platform.
Data correspond to usage on the plateform after 2015. The current usage metrics is available 48-96 hours after online publication and is updated daily on week days.
Initial download of the metrics may take a while.