Open Access
Fig. 9
Download original image
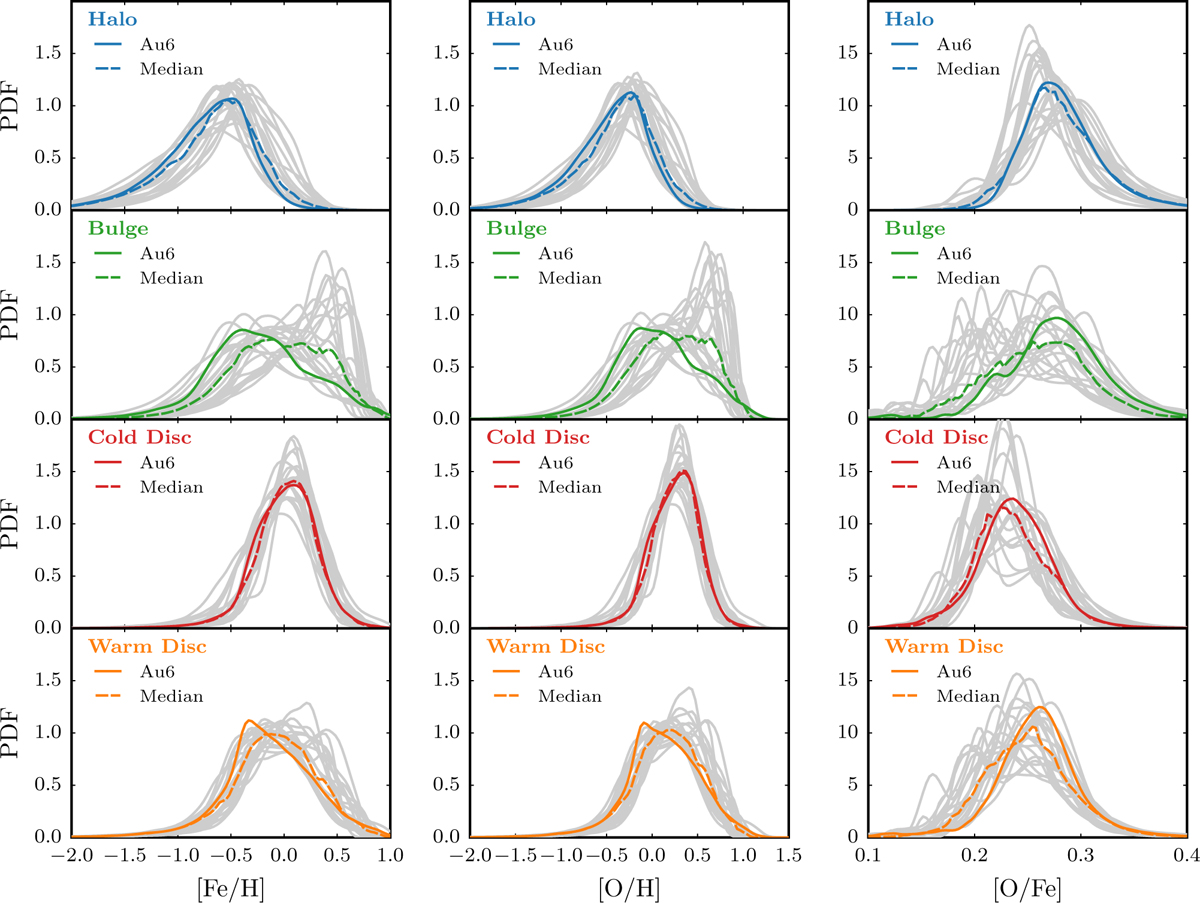
Distribution of the [Fe/H] (left), [O/H] (middle), and [O/Fe] (right) metal abundances for the Auriga sample. Each row shows a different galactic component, as indicated in the top left. In each panel, grey curves show the distribution of each galaxy in the sample, highlighting Au6 in colour.
Current usage metrics show cumulative count of Article Views (full-text article views including HTML views, PDF and ePub downloads, according to the available data) and Abstracts Views on Vision4Press platform.
Data correspond to usage on the plateform after 2015. The current usage metrics is available 48-96 hours after online publication and is updated daily on week days.
Initial download of the metrics may take a while.