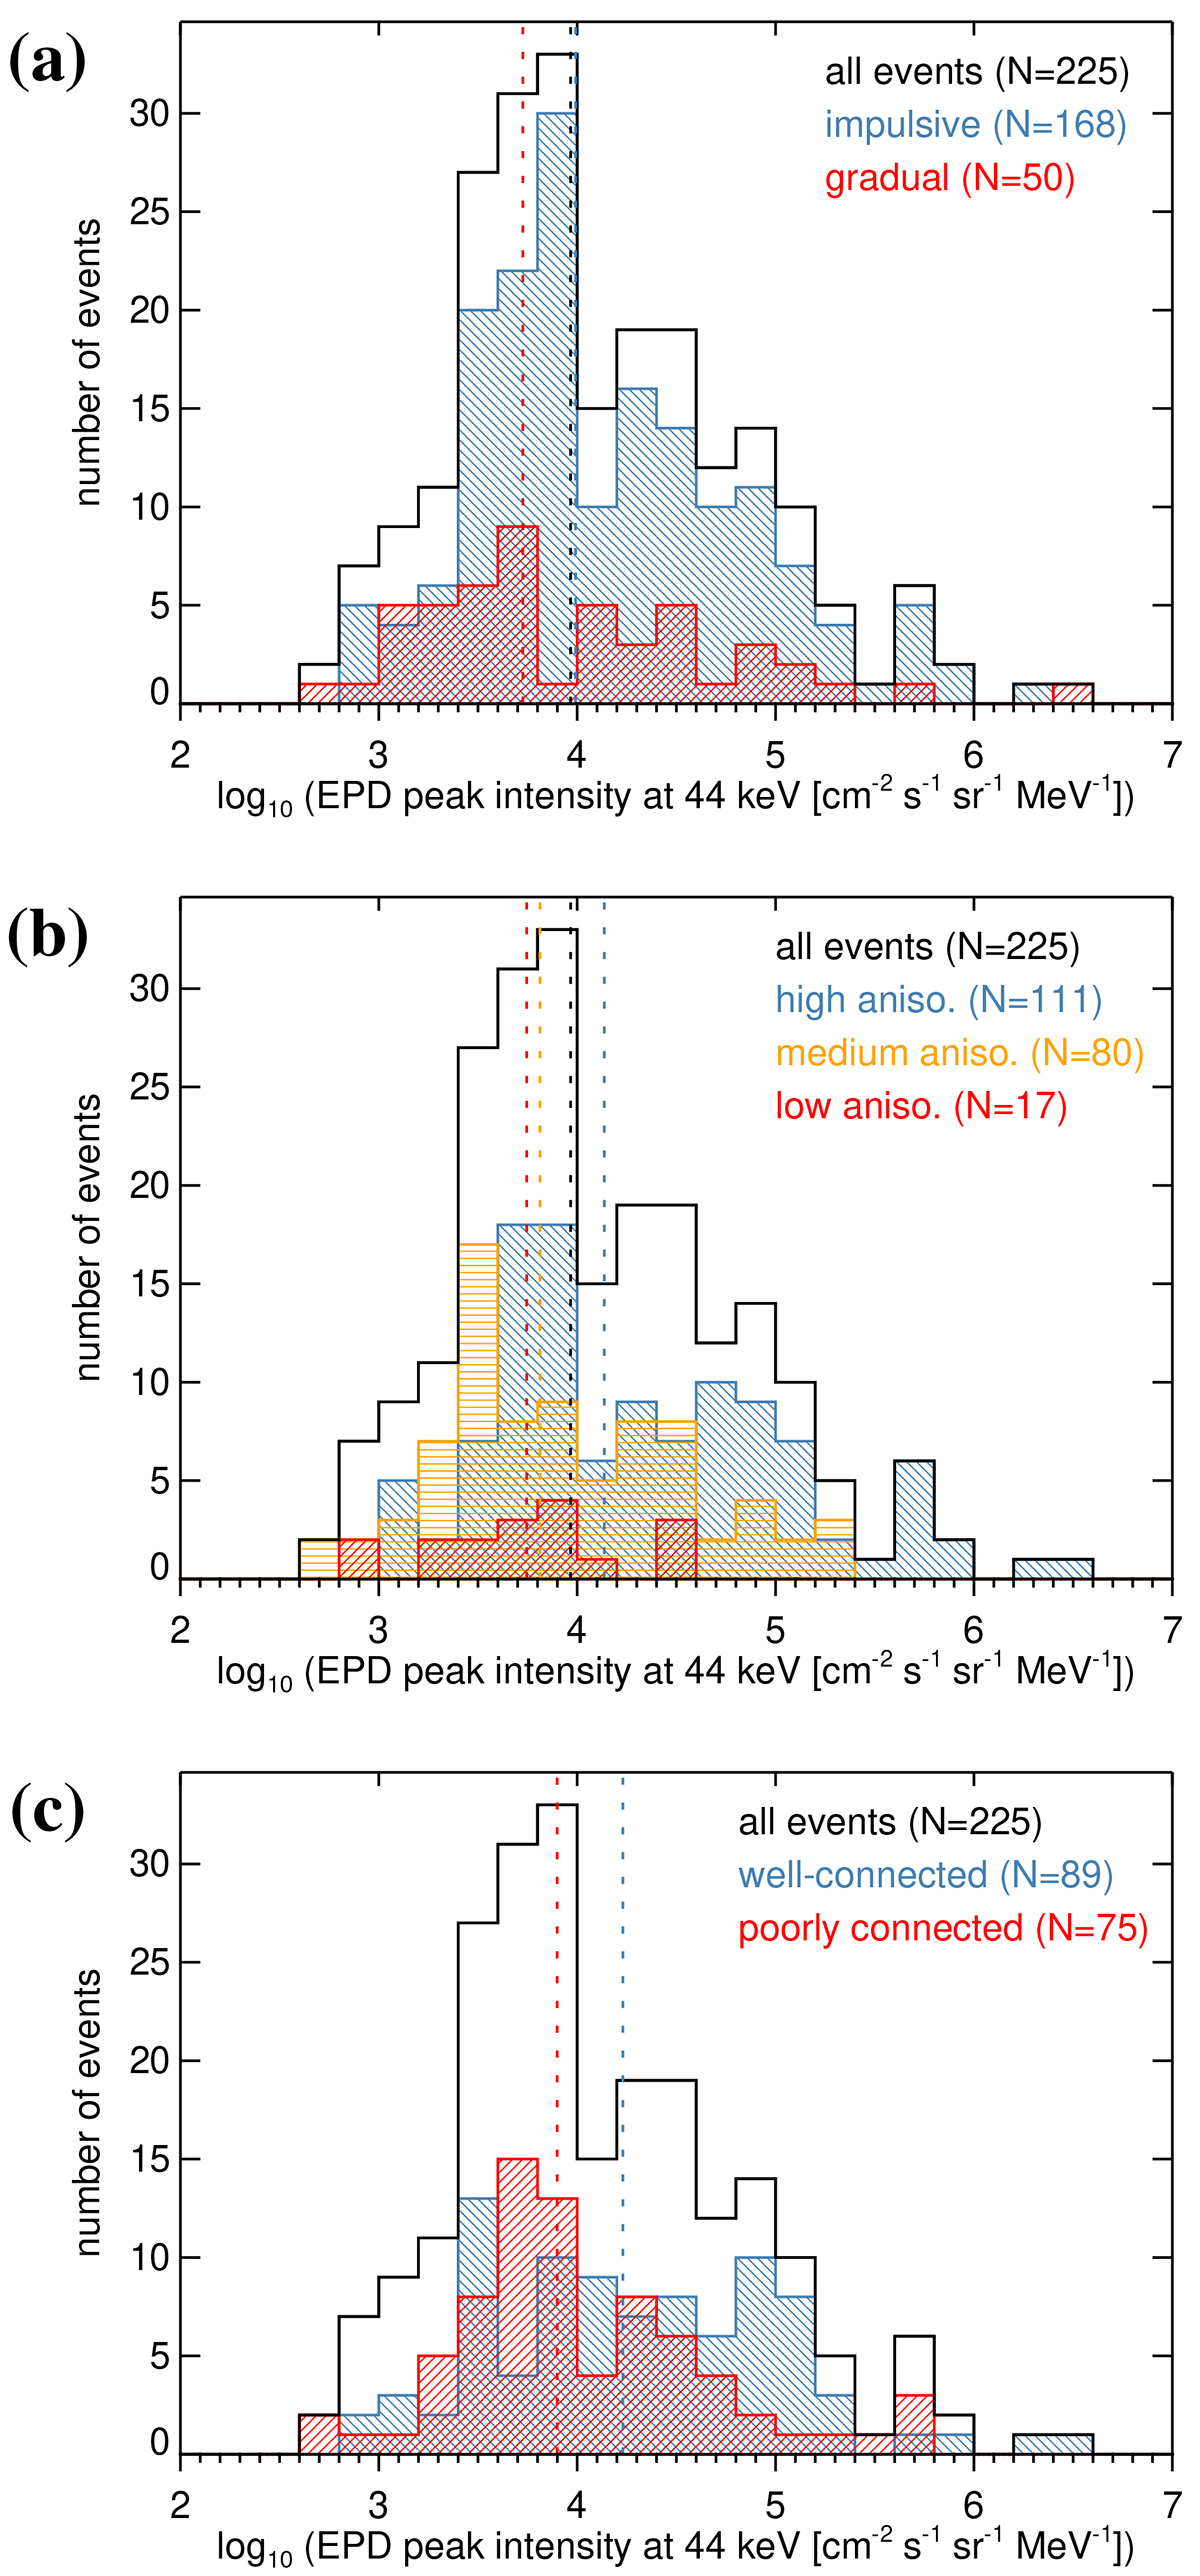
Fig. 12.
Download original image
Results on the SEE peak intensities measured at 44 keV. (a): SEE peak intensities, with impulsive event distributions shown in blue, gradual ones in red, and the black outline representing all events. Dotted lines show the medians of the distributions. (b): Peak intensities for SEEs with large (blue), medium (yellow), and small anisotropy (red). (c): Peak intensities for well-connected SEEs (blue) as opposed to poorly connected ones (red), where well-connected events are defined as having a separation in longitude between the STIX source and the footpoint of magnetic connectivity of less than 20°.
Current usage metrics show cumulative count of Article Views (full-text article views including HTML views, PDF and ePub downloads, according to the available data) and Abstracts Views on Vision4Press platform.
Data correspond to usage on the plateform after 2015. The current usage metrics is available 48-96 hours after online publication and is updated daily on week days.
Initial download of the metrics may take a while.