Open Access
Fig. 18.
Download original image
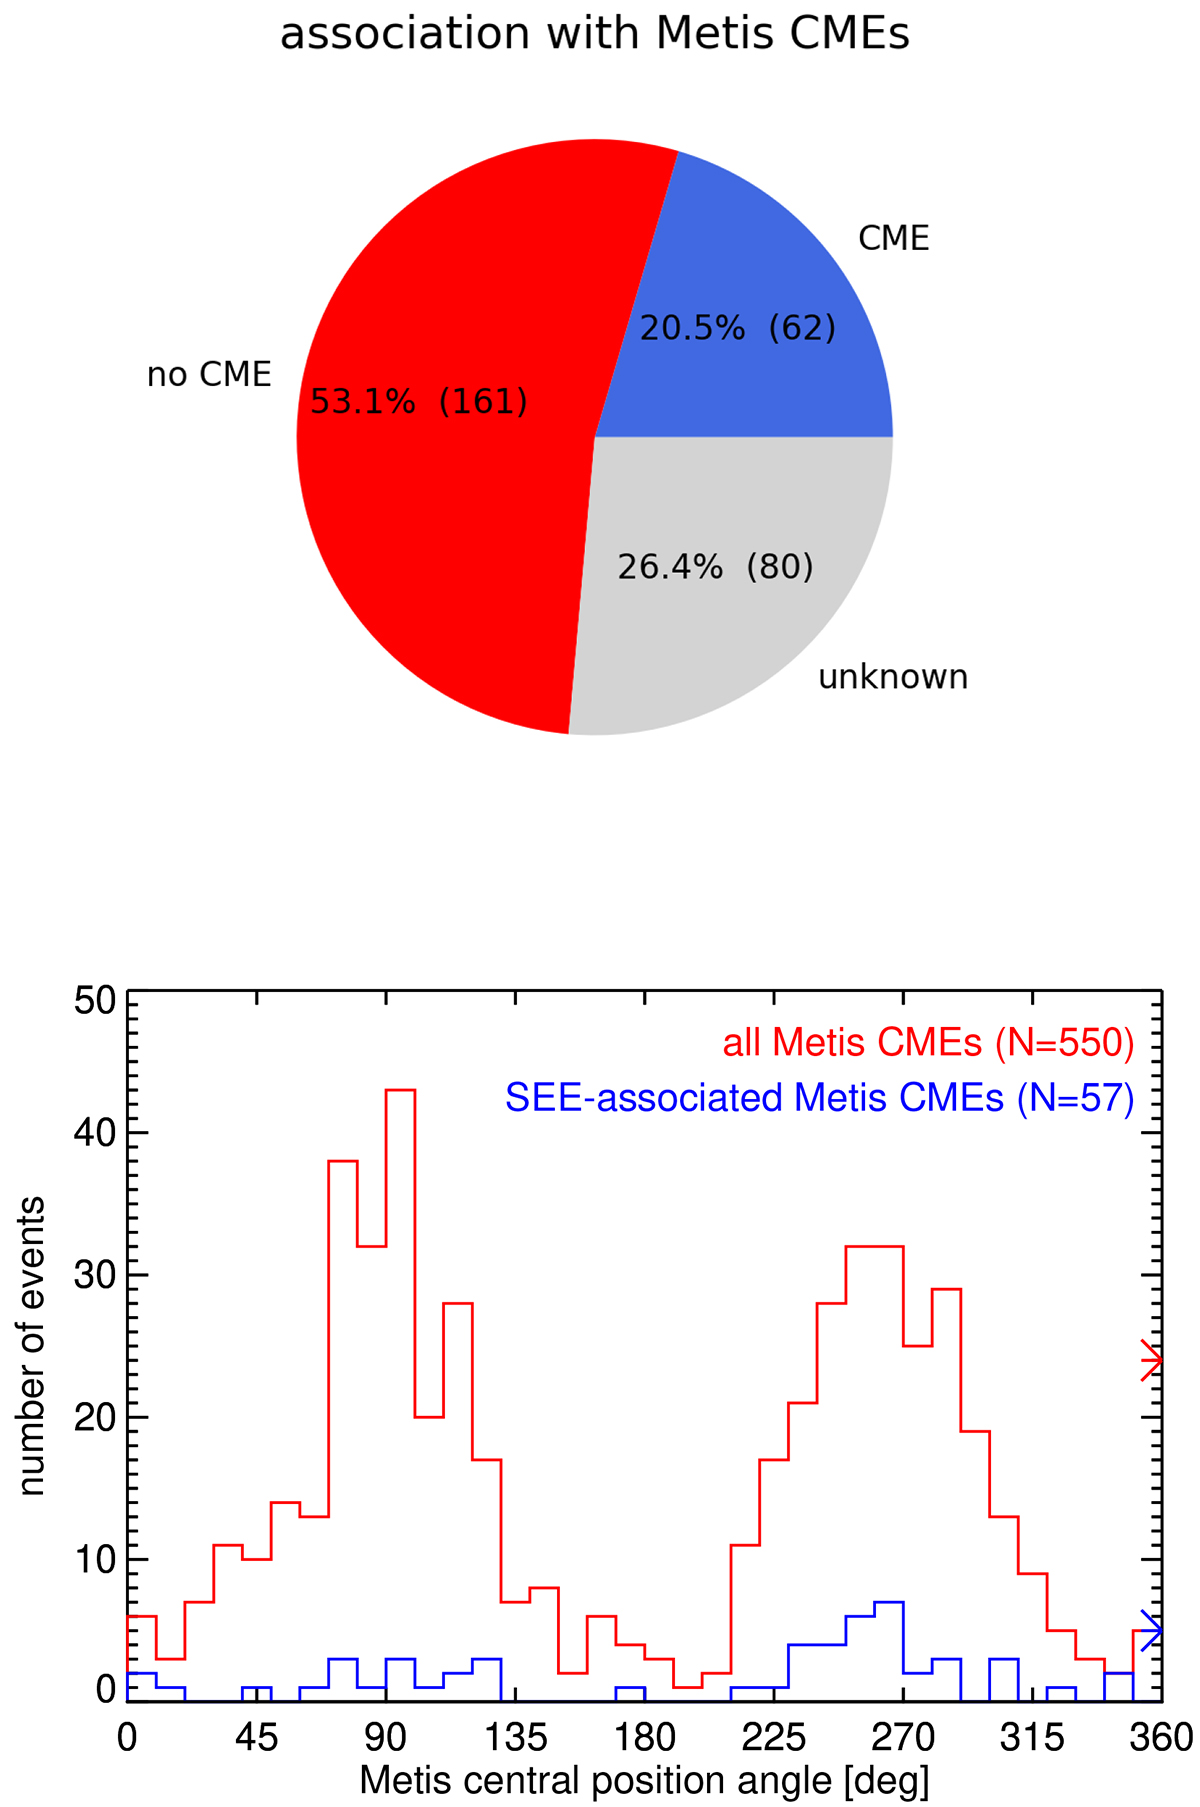
Top: Relative numbers of SEE events according to their association with Metis CMEs. Bottom: Distribution of the CME central position angles, for the total sample of observed Metis CMEs (red) and the CMEs associated with SEE events (blue). The asterisks at the right border of the plot show the number of halo CMEs.
Current usage metrics show cumulative count of Article Views (full-text article views including HTML views, PDF and ePub downloads, according to the available data) and Abstracts Views on Vision4Press platform.
Data correspond to usage on the plateform after 2015. The current usage metrics is available 48-96 hours after online publication and is updated daily on week days.
Initial download of the metrics may take a while.