Fig. 19.
Download original image
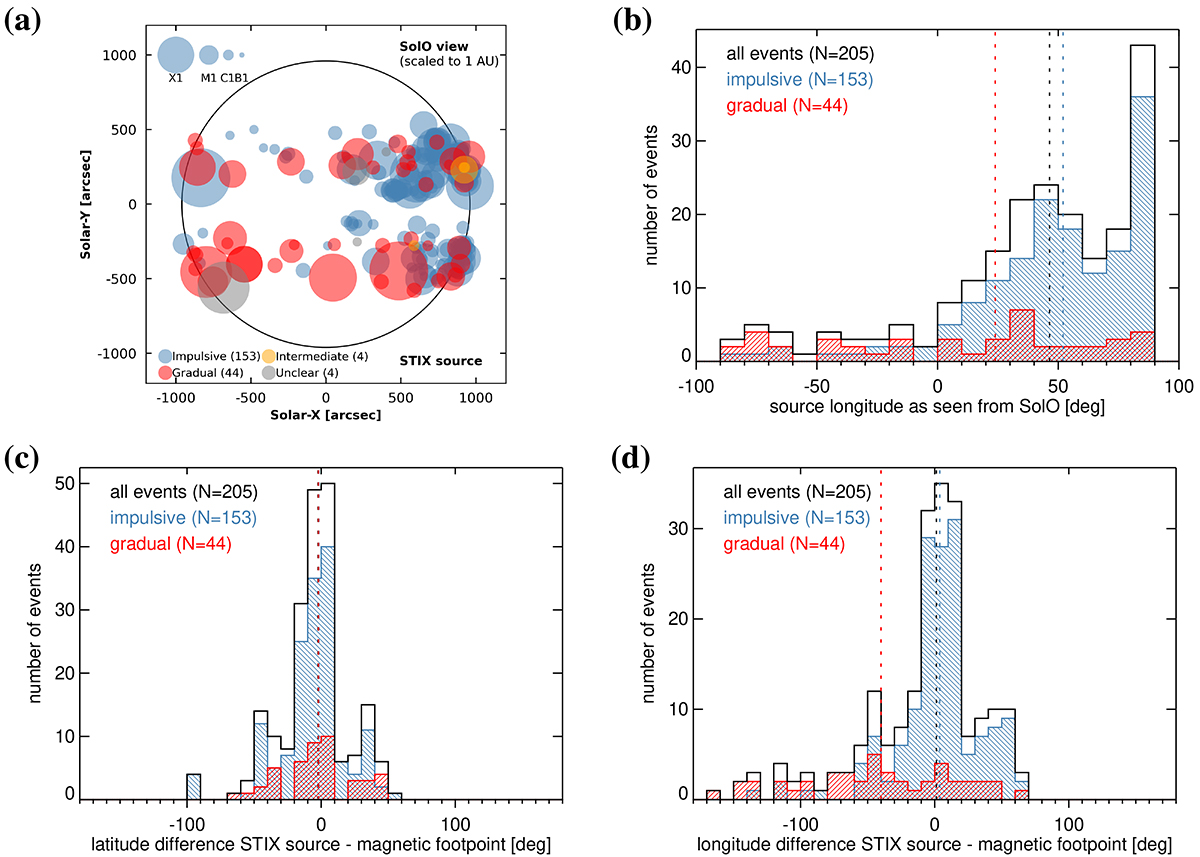
(a): STIX source positions as seen from Solar Orbiter. All positions have been rescaled to 1 au. The size of the circles corresponds to the GOES peak estimate, while the colours indicate the composition. (b): STIX X-ray source longitude as seen from Solar Orbiter. (c): Heliographic latitude difference between the STIX source and the footpoint of magnetic connectivity. Impulsive event distributions are shown in blue, gradual ones in red, and the black histogram represents all events. Dotted lines show the medians of the distributions for impulsive and gradual events. (d): As in (c), but showing the heliographic longitude difference between the STIX source and the footpoint of magnetic connectivity.
Current usage metrics show cumulative count of Article Views (full-text article views including HTML views, PDF and ePub downloads, according to the available data) and Abstracts Views on Vision4Press platform.
Data correspond to usage on the plateform after 2015. The current usage metrics is available 48-96 hours after online publication and is updated daily on week days.
Initial download of the metrics may take a while.