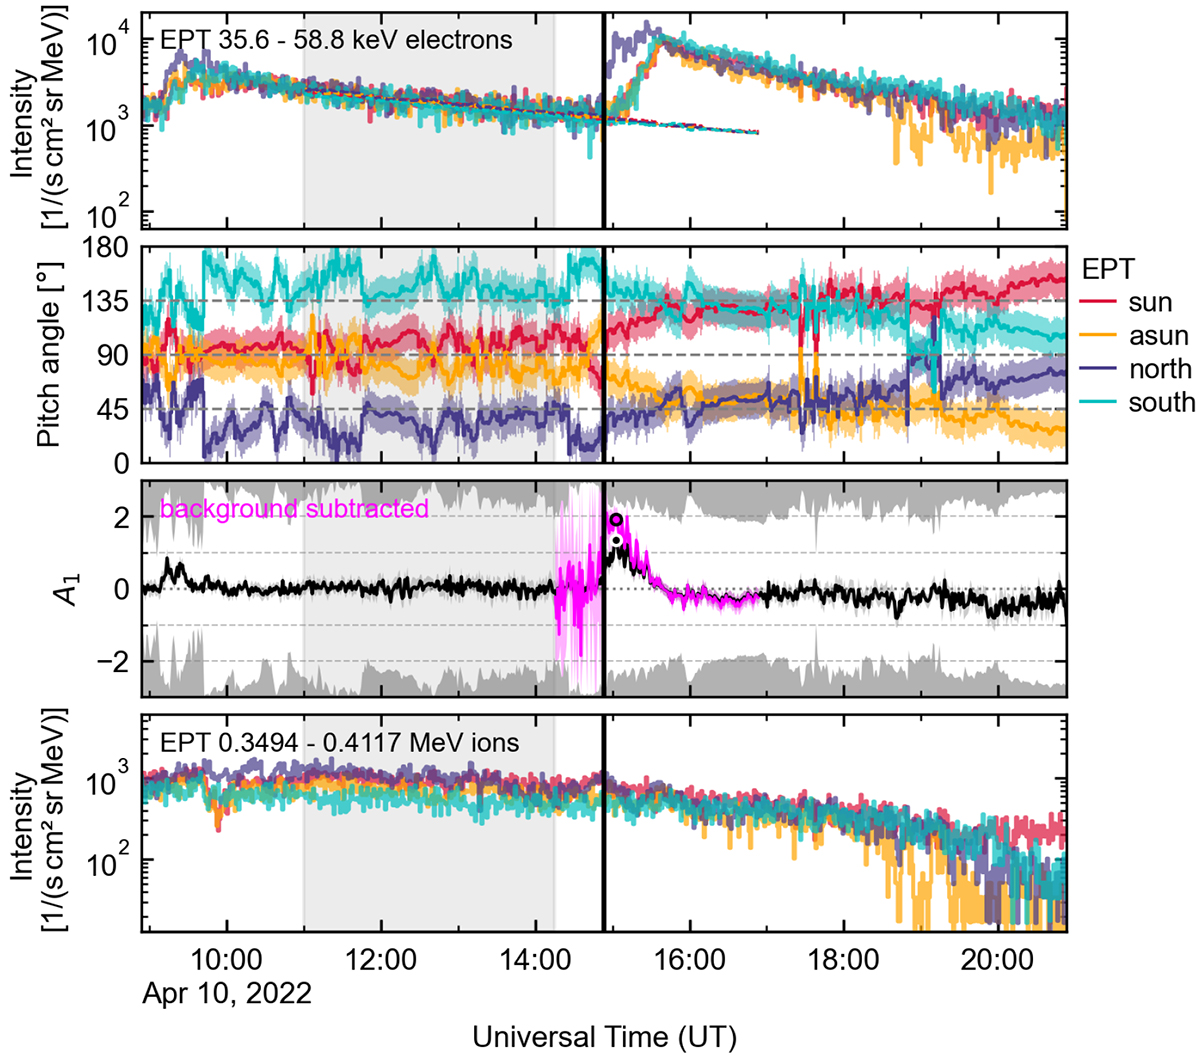
Fig. 2.
Download original image
Example plot of EPT observations on 2022 April 10 (event ID 2204101453). The vertical black line denotes the event onset time. The selected background interval is shaded in grey. Top panel: 35.6–58.8 keV electron intensities (solid lines) as observed by the four telescopes. The dashed lines show the modelled background intensitiesduring the time interval of interest. Second panel: Pitch-angle ranges covered by the telescopes. Third panel: First-order anisotropy for the measured electron intensities without (black line) and with background subtraction (magenta line) with the 95% confidence intervals shaded and the peaks denoted as the black and the magenta dots, respectively. The dark grey shading at the top and bottom boundaries denotes anisotropy values that cannot be observed with the given pitch-angle coverage. Bottom panel: 0.349–0.412 MeV ion intensities as observed by the four telescopes.
Current usage metrics show cumulative count of Article Views (full-text article views including HTML views, PDF and ePub downloads, according to the available data) and Abstracts Views on Vision4Press platform.
Data correspond to usage on the plateform after 2015. The current usage metrics is available 48-96 hours after online publication and is updated daily on week days.
Initial download of the metrics may take a while.