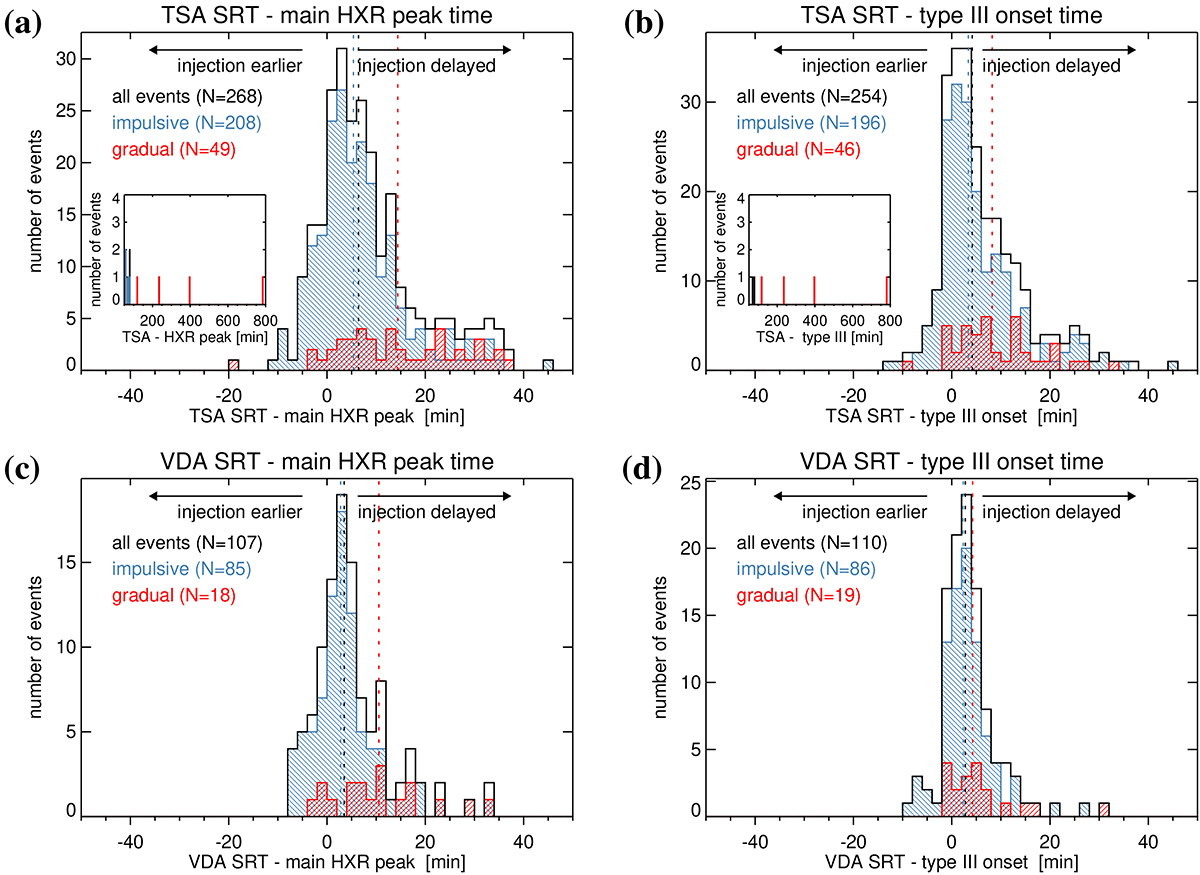
Fig. 21.
Download original image
SRTs of SEEs relative to the times of the main nonthermal STIX peak and the type III burst onset. (a): TSA SRTs relative to main nonthermal STIX peak. (b): TSA SRTs relative to type III onset. (c): VDA SRTs relative to main nonthermal STIX peak. (d): VDA SRTs relative to type III onset. Impulsive events are shown in blue, gradual ones in red, and the black histogram outlines represent all events. Dotted lines show the medians of the distributions for impulsive and gradual events.
Current usage metrics show cumulative count of Article Views (full-text article views including HTML views, PDF and ePub downloads, according to the available data) and Abstracts Views on Vision4Press platform.
Data correspond to usage on the plateform after 2015. The current usage metrics is available 48-96 hours after online publication and is updated daily on week days.
Initial download of the metrics may take a while.