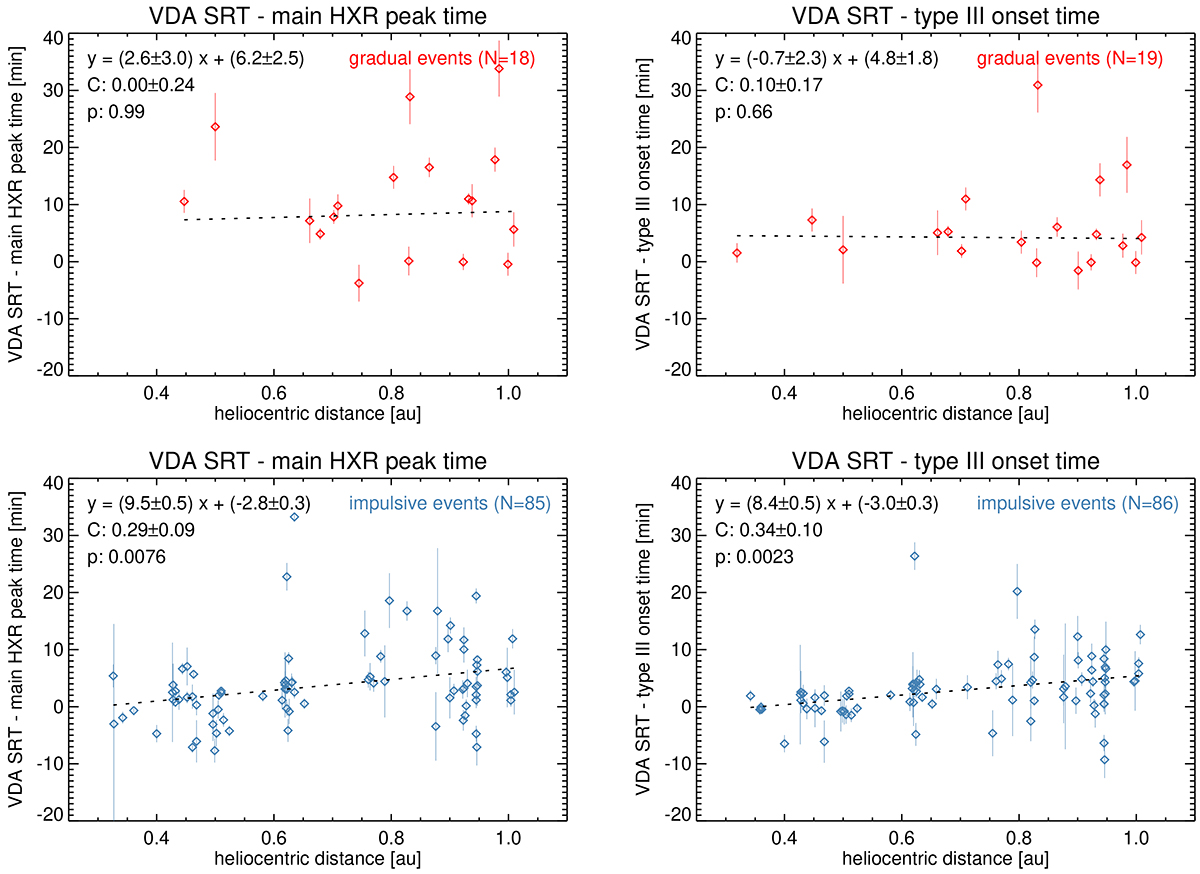
Fig. 22.
Download original image
Time difference between SRT (determined with VDA) and solar events plotted versus heliocentric distance. The solar reference times used correspond to the main STIX HXR peak (left) and the RPW type III onset (right). The top row shows gradual events, the bottom row impulsive events. Error bars indicate the one-sigma VDA fit uncertainties. Also shown is the number of events, a linear fit (dotted line) with fit parameters and uncertainties, the Pearson correlation coefficients C, and the p-values p.
Current usage metrics show cumulative count of Article Views (full-text article views including HTML views, PDF and ePub downloads, according to the available data) and Abstracts Views on Vision4Press platform.
Data correspond to usage on the plateform after 2015. The current usage metrics is available 48-96 hours after online publication and is updated daily on week days.
Initial download of the metrics may take a while.