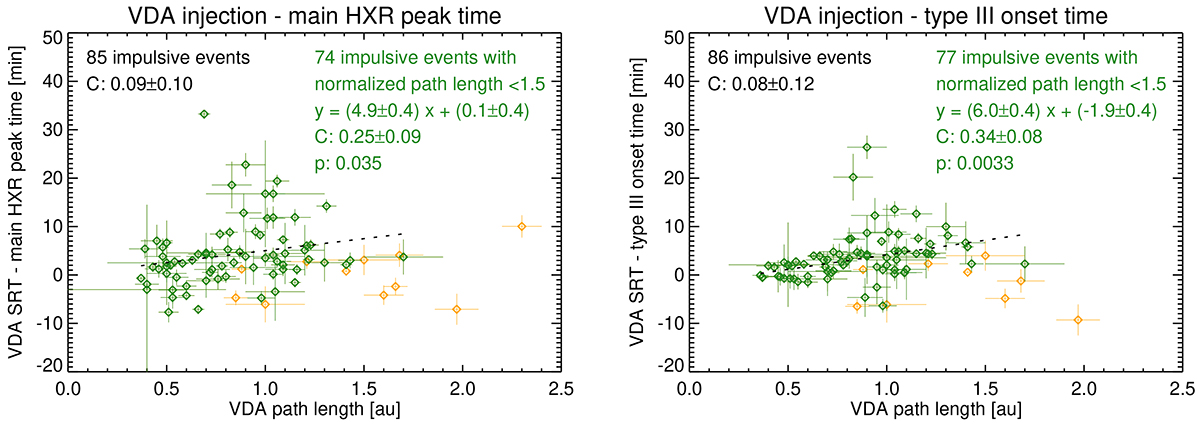
Fig. 24.
Download original image
VDA SRT time difference with respect to the main STIX HXR peak (left) and the RPW type III onset (right) as a function of the VDA path length. The green diamonds correspond to the events with normalised path lengths shorter than 1.5 times the nominal Parker spiral lengths, while the rest of the sample is shown with orange diamonds. The plots also indicate the number of events and the correlation coefficients for all events in black, and for the well-connected events in green. For the latter events, a linear fit, the fit parameters, and the p-value is shown as well. Error bars indicate the one-sigma VDA fit uncertainties for the path length and the SRT.
Current usage metrics show cumulative count of Article Views (full-text article views including HTML views, PDF and ePub downloads, according to the available data) and Abstracts Views on Vision4Press platform.
Data correspond to usage on the plateform after 2015. The current usage metrics is available 48-96 hours after online publication and is updated daily on week days.
Initial download of the metrics may take a while.