Fig. 3.
Download original image
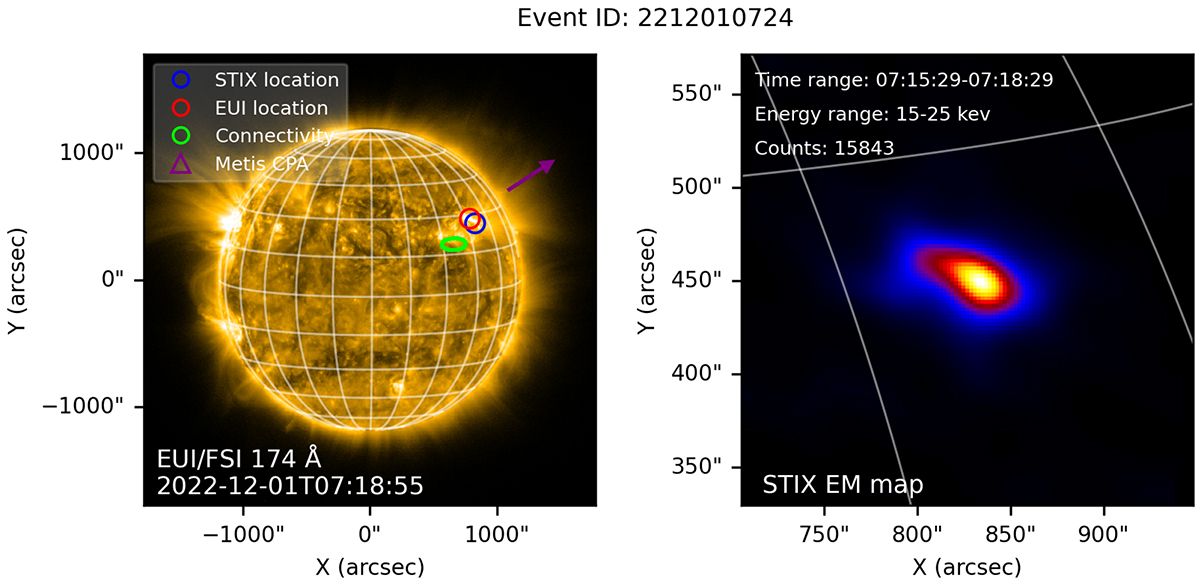
Example plot showing flare locations and magnetic connectivity for an event on 2022 December 1 (event ID 2212010724). Left panel: Full-disc EUV image in the 174 Å band provided by EUI/FSI. Overplotted are the flare locations derived from STIX and EUI, shown as blue and red circles, respectively. The green ellipse indicates the footpoint of magnetic connectivity provided by the IRAP tool. The size of the ellipse reflects the uncertainties in longitude and latitude. The purple arrow indicates the central position angle of a possibly associated CME observed by Metis. Right panel: X-ray source reconstructed from STIX data with the EM algorithm.
Current usage metrics show cumulative count of Article Views (full-text article views including HTML views, PDF and ePub downloads, according to the available data) and Abstracts Views on Vision4Press platform.
Data correspond to usage on the plateform after 2015. The current usage metrics is available 48-96 hours after online publication and is updated daily on week days.
Initial download of the metrics may take a while.