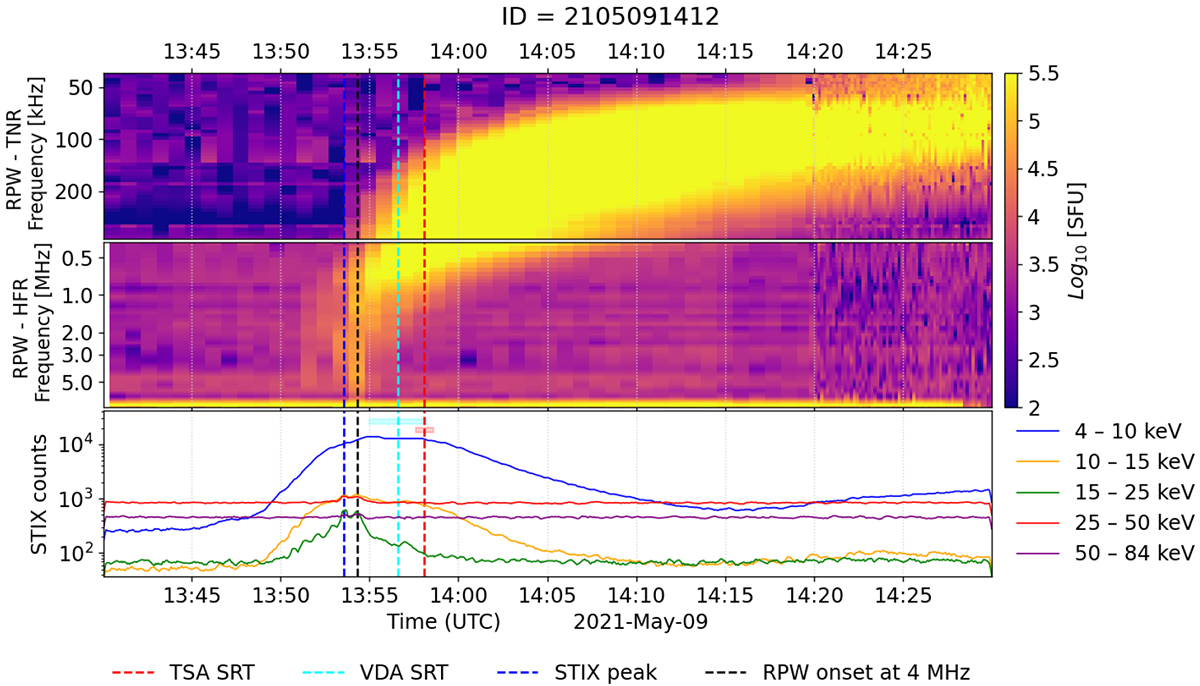
Fig. 4.
Download original image
Example of a combined RPW-STIX plot for an event on 2021 May 9 (event ID 2105091412). The two upper panels show the measured radio flux in solar flux units (SFU) versus time and frequency measured by RPW/TNR and RPW/HFR. The bottom panel shows the X-ray flux in counts per 4 s as measured by STIX. Vertical dashed lines indicate the following times: electron SRTs derived from EPD data by TSA and VDA analysis, time of maximum X-ray flux from STIX, and the RPW onset times (details given in the main text) detected at 4 MHz or 1 MHz. Horizontal shaded areas at the top of the bottom panel indicate the uncertainties of the TSA and VDA SRTs following the same colour code.
Current usage metrics show cumulative count of Article Views (full-text article views including HTML views, PDF and ePub downloads, according to the available data) and Abstracts Views on Vision4Press platform.
Data correspond to usage on the plateform after 2015. The current usage metrics is available 48-96 hours after online publication and is updated daily on week days.
Initial download of the metrics may take a while.