Fig. 5.
Download original image
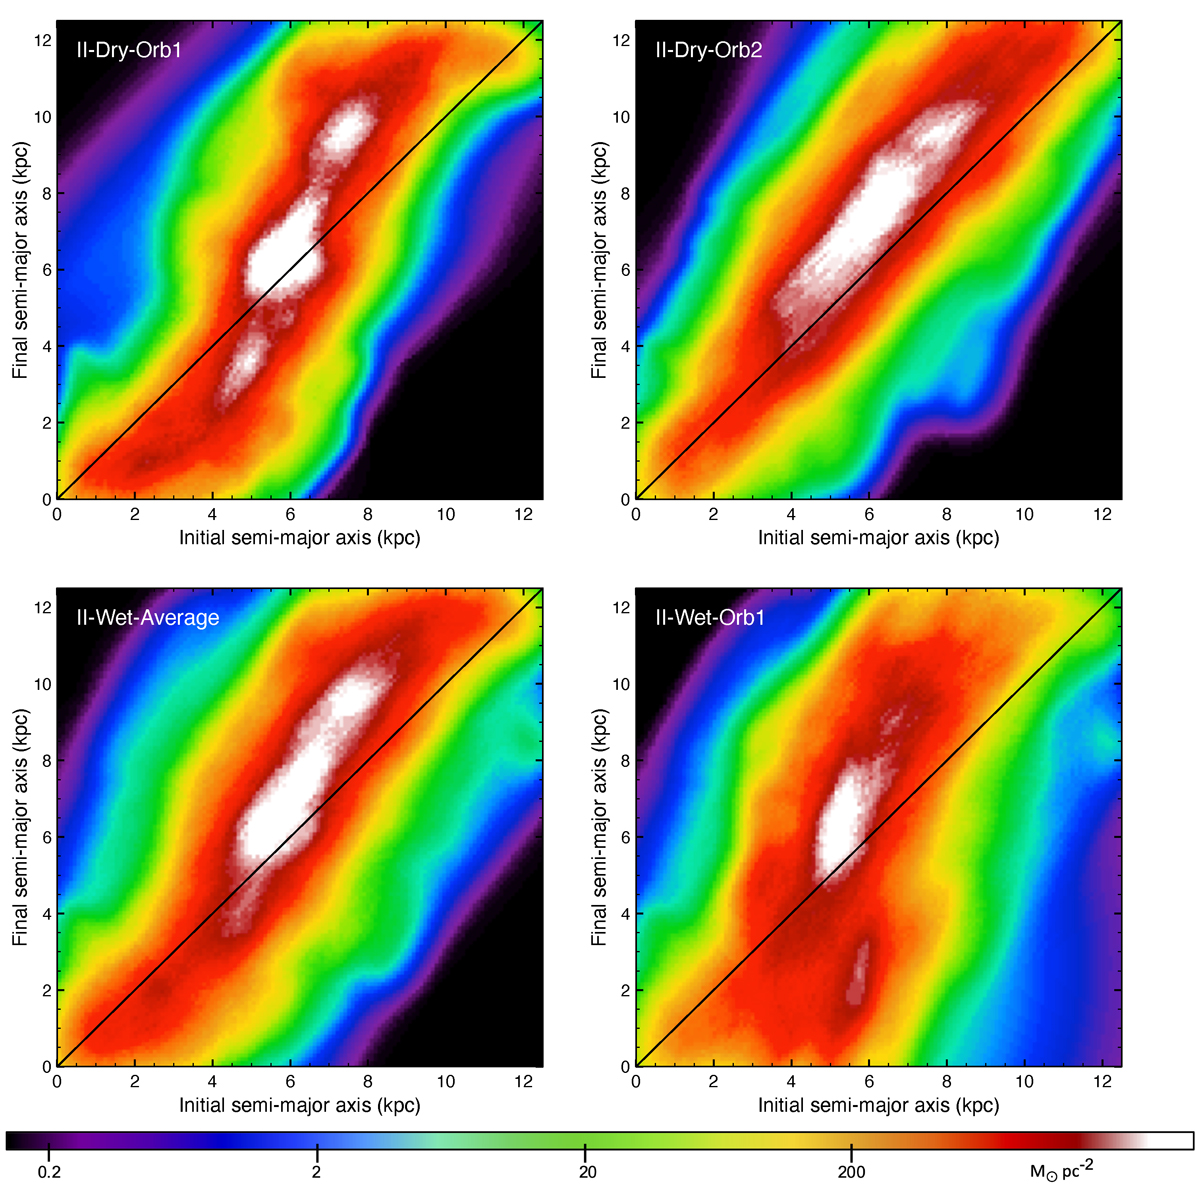
Mass-weighted distribution of disc stars as a function of their initial and final semi-major axes at t = 1.5 Gyr. Top panels: results for the II-Dry-Orb1 (left) and II-Dry-Orb2 (right) simulations. Bottom panels: Mass-weighted average over all wet simulations (left) and a representative wet case on a direct orbit (right). The solid black line marks the 1:1 relation (i.e. no change in semi-major axis). We note that this is not a particle-based plot, but a binned, mass-weighted representation. The colour values (in M⊙ pc−2) indicate the stellar mass redistributed from a given initial to a final semi-major axis bin. This binning method can yield higher values at intermediate radii than in the central region, due to differing amounts of radial migration and local mass distribution.
Current usage metrics show cumulative count of Article Views (full-text article views including HTML views, PDF and ePub downloads, according to the available data) and Abstracts Views on Vision4Press platform.
Data correspond to usage on the plateform after 2015. The current usage metrics is available 48-96 hours after online publication and is updated daily on week days.
Initial download of the metrics may take a while.