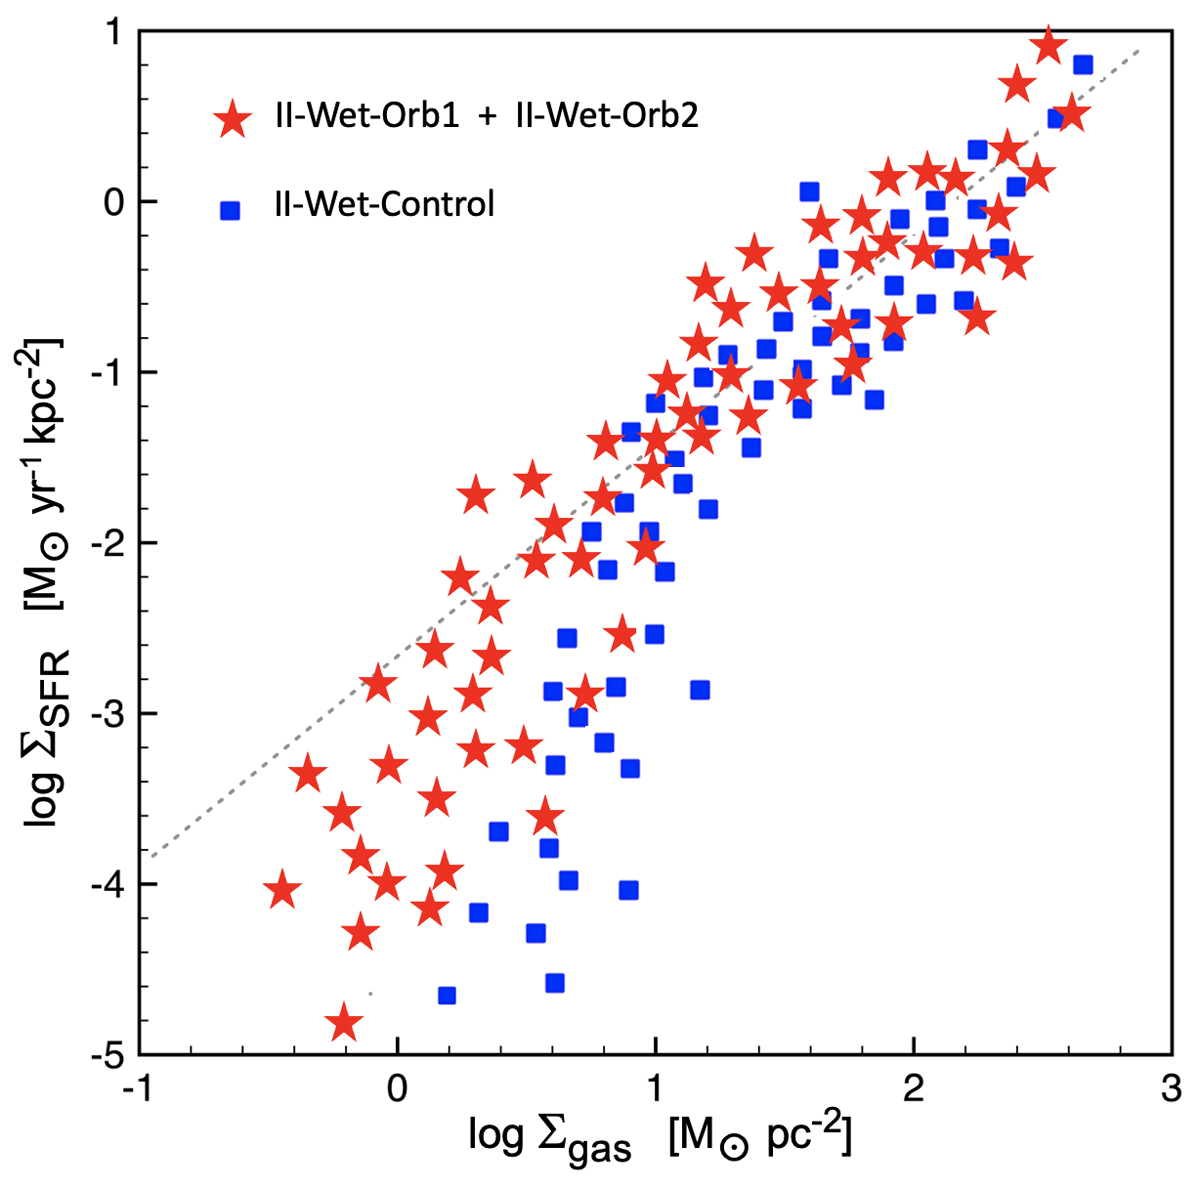
Fig. 7.
Download original image
Relation between gas surface density and star formation rate surface density, measured with the disc seen face-on and over circular regions of radius 500 pc. The centre of each region is selected randomly outside the central 2 kpc. We did study the bulge region and contamination through it. The dashed black line is the relation defined for nearby disc galaxies by Leroy et al. (2008a). The II-Wet-Control run is shown with blue squares and the average or II-Wet-Orb1 and II-Wet-Orb2 with red squares, no meaningful difference is found between the two runs, or with other II-Wet runs.
Current usage metrics show cumulative count of Article Views (full-text article views including HTML views, PDF and ePub downloads, according to the available data) and Abstracts Views on Vision4Press platform.
Data correspond to usage on the plateform after 2015. The current usage metrics is available 48-96 hours after online publication and is updated daily on week days.
Initial download of the metrics may take a while.