Open Access
Fig. 1
Download original image
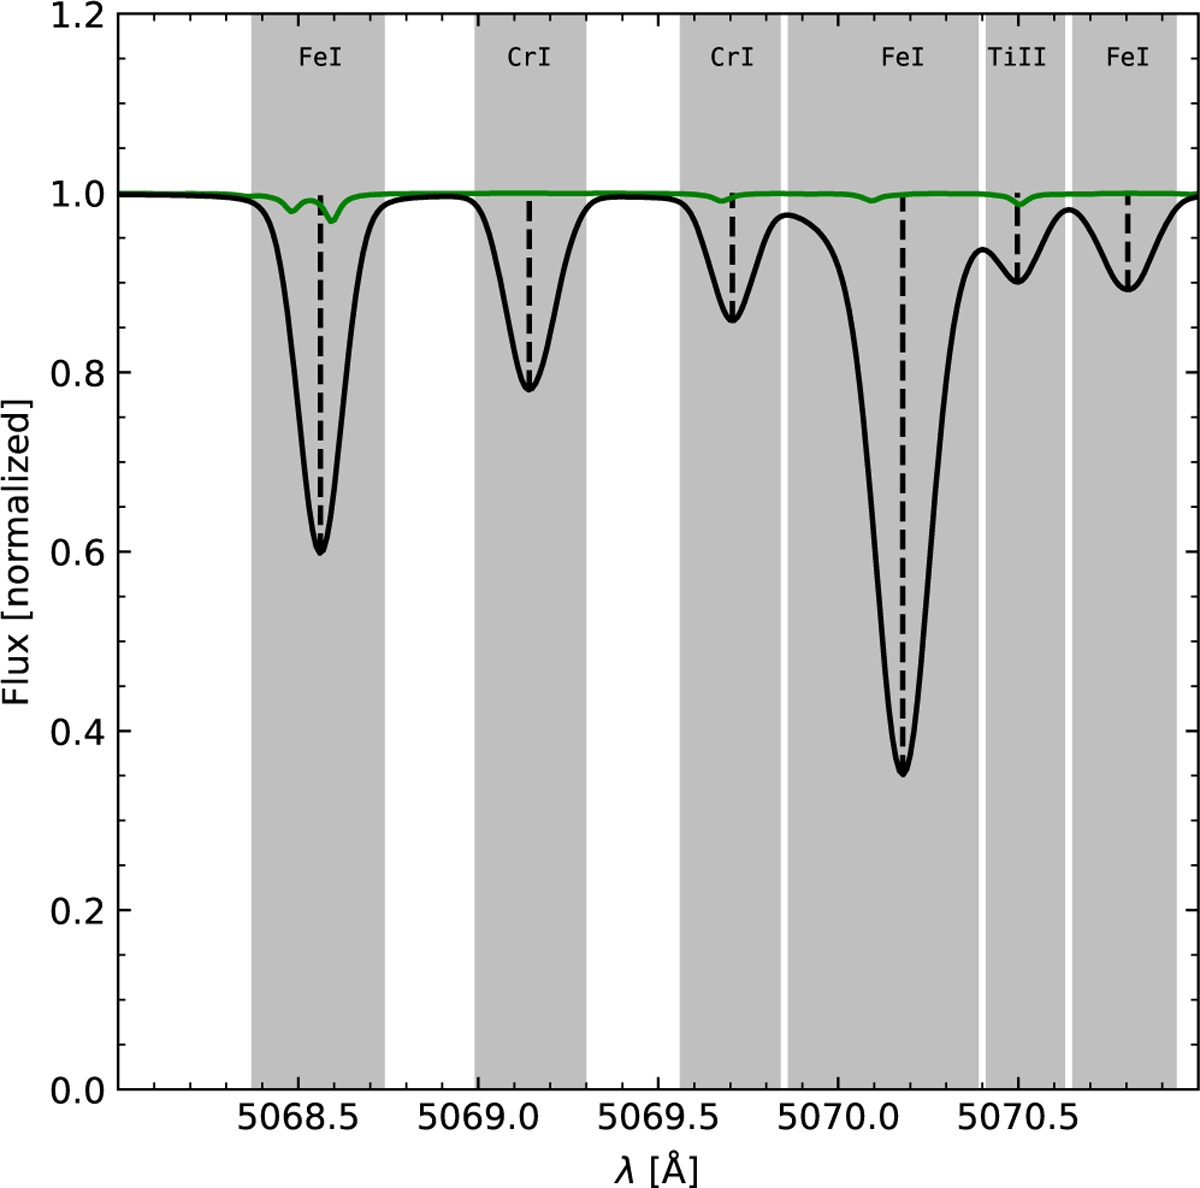
Example of spectral line mask portion for the G2 spectral type. The synthetic flux spectrum (black) and telluric spectrum (green) are shown together with the identified spectral lines (gray windows) whose wavelengths at flux minimum (black dashed lines) and elemental species (text annotations) are highlighted.
Current usage metrics show cumulative count of Article Views (full-text article views including HTML views, PDF and ePub downloads, according to the available data) and Abstracts Views on Vision4Press platform.
Data correspond to usage on the plateform after 2015. The current usage metrics is available 48-96 hours after online publication and is updated daily on week days.
Initial download of the metrics may take a while.