Fig. 3
Download original image
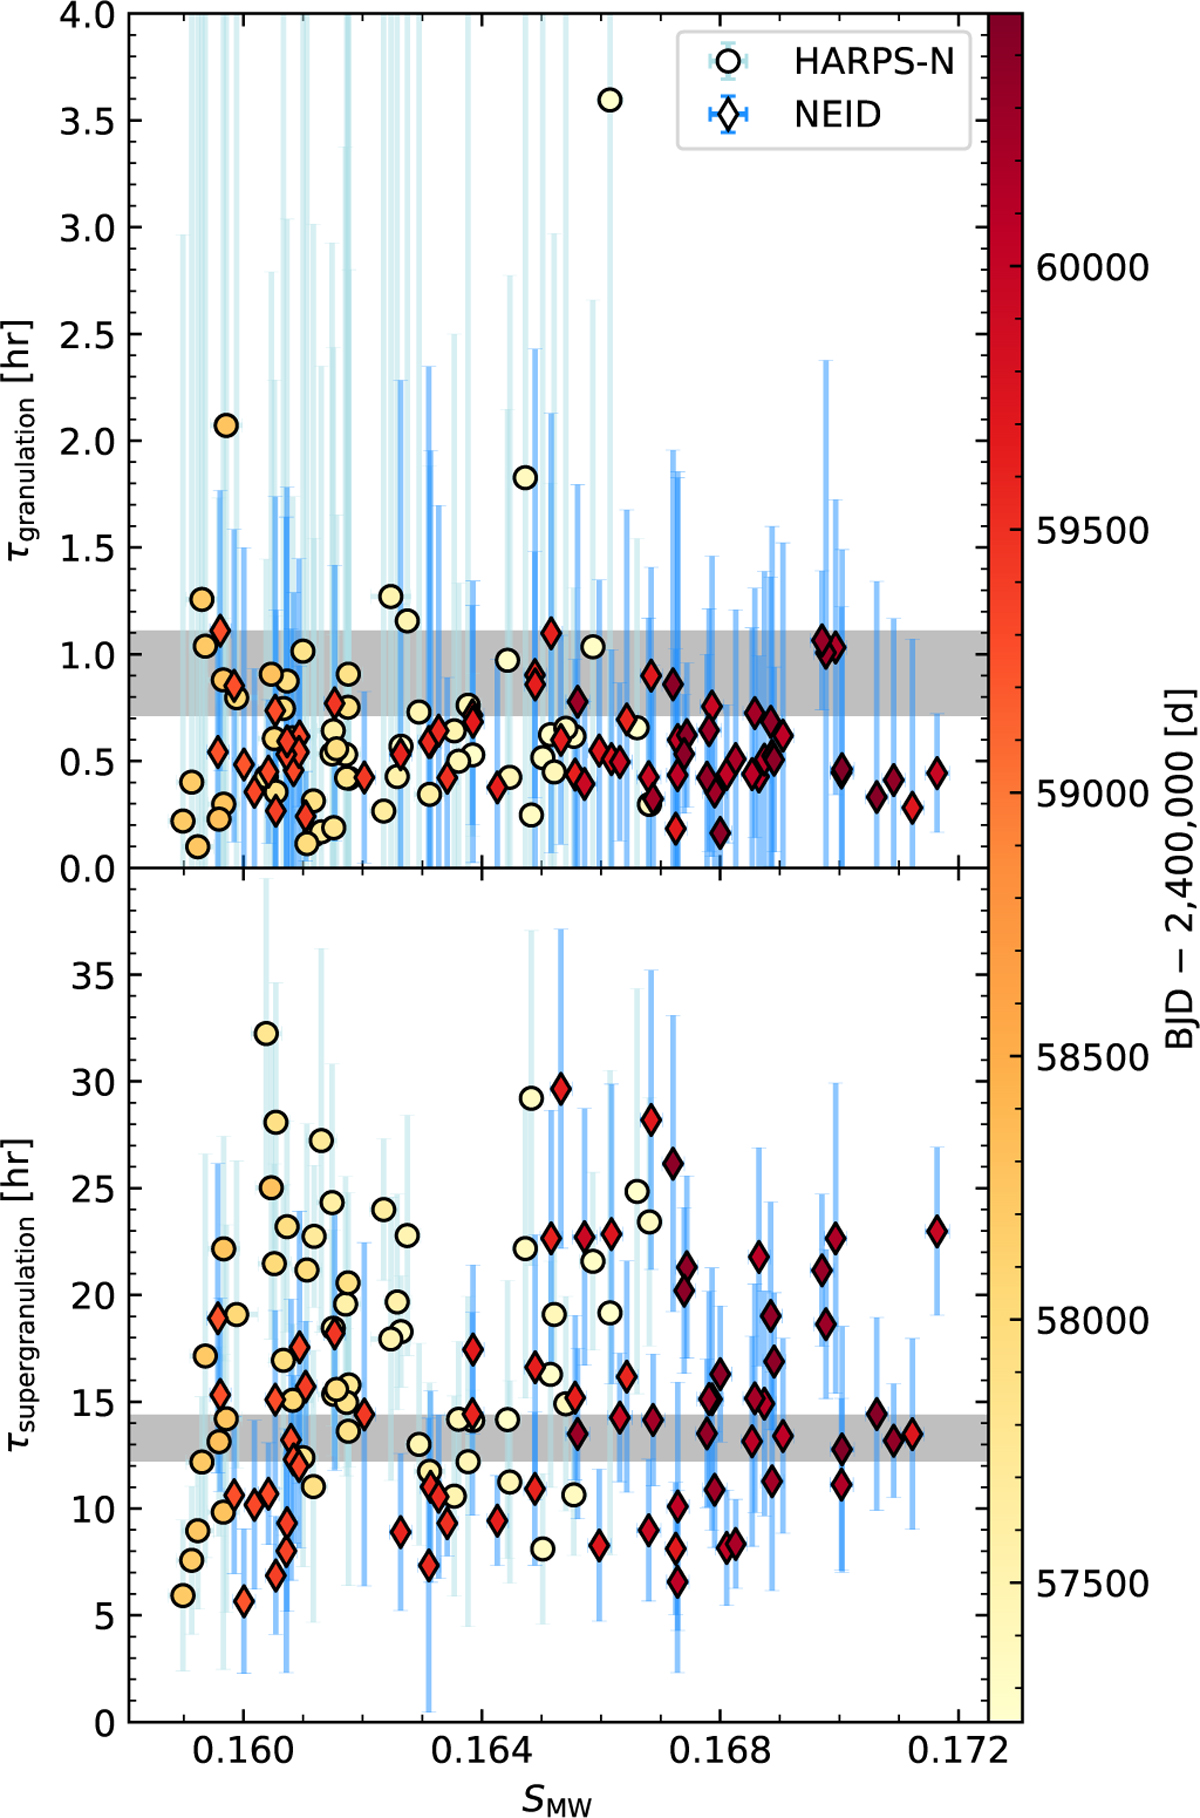
Solar granulation characteristic timescales at different activity levels. Upper panel: best-fit granulation characteristic timescale computed on 10 d-intervals of the HARPS-N (circles with light blue error bars) and NEID (diamonds with dark blue error bars) solar RV time series. The abscissa shows the activity level as traced by the average SMW index within each interval. The markers are color-coded by the average time of the points within each interval. The gray-shaded region shows the best-fit granulation timescale with ±1σ uncertainties obtained by Al Moulla et al. (2023) from a combined data set of HARPS-N and HARPS solar RVs. Lower panel: same as the upper panel, but for the supergranulation timescale.
Current usage metrics show cumulative count of Article Views (full-text article views including HTML views, PDF and ePub downloads, according to the available data) and Abstracts Views on Vision4Press platform.
Data correspond to usage on the plateform after 2015. The current usage metrics is available 48-96 hours after online publication and is updated daily on week days.
Initial download of the metrics may take a while.