Fig. A.1
Download original image
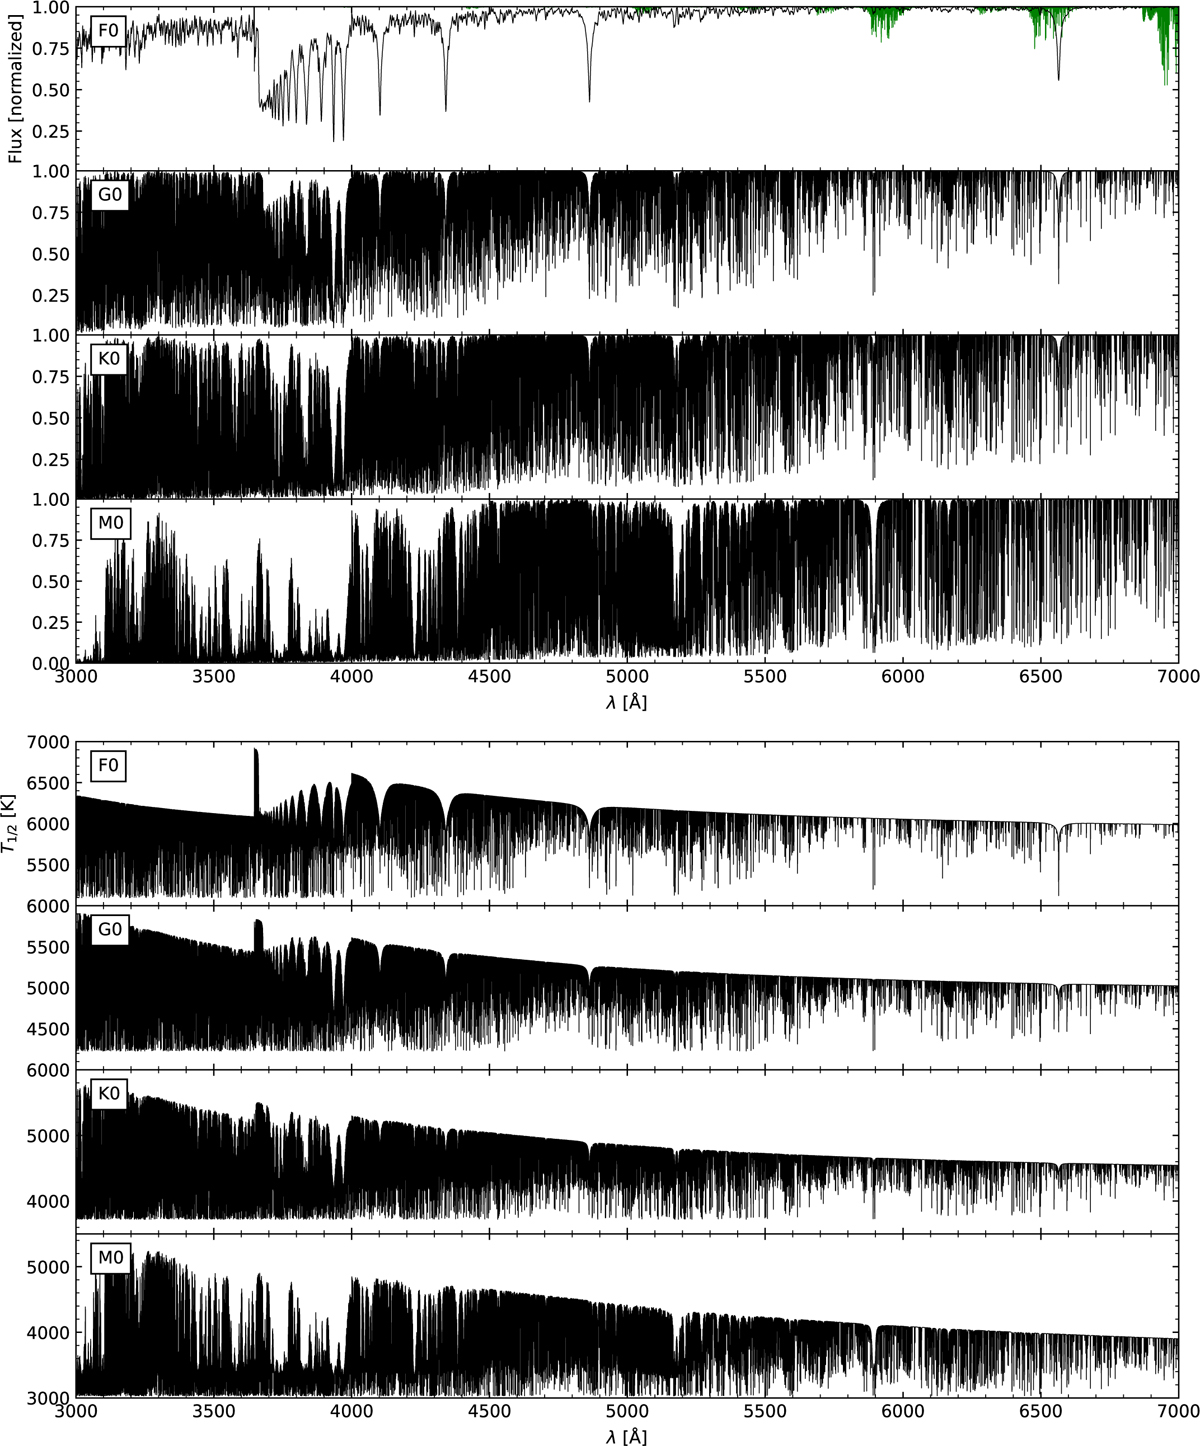
Sample of synthetic spectra. Upper panels: Normalized flux spectra from the pre-computed grid between the wavelengths 3000–7000 Å. Spectral types F0, G0, K0, and M0 are shown from top to bottom. In the first panel, the telluric spectrum is shown in green. Lower panels: Same as the upper panels, but with the average formation temperature, T1/2, instead of flux.
Current usage metrics show cumulative count of Article Views (full-text article views including HTML views, PDF and ePub downloads, according to the available data) and Abstracts Views on Vision4Press platform.
Data correspond to usage on the plateform after 2015. The current usage metrics is available 48-96 hours after online publication and is updated daily on week days.
Initial download of the metrics may take a while.