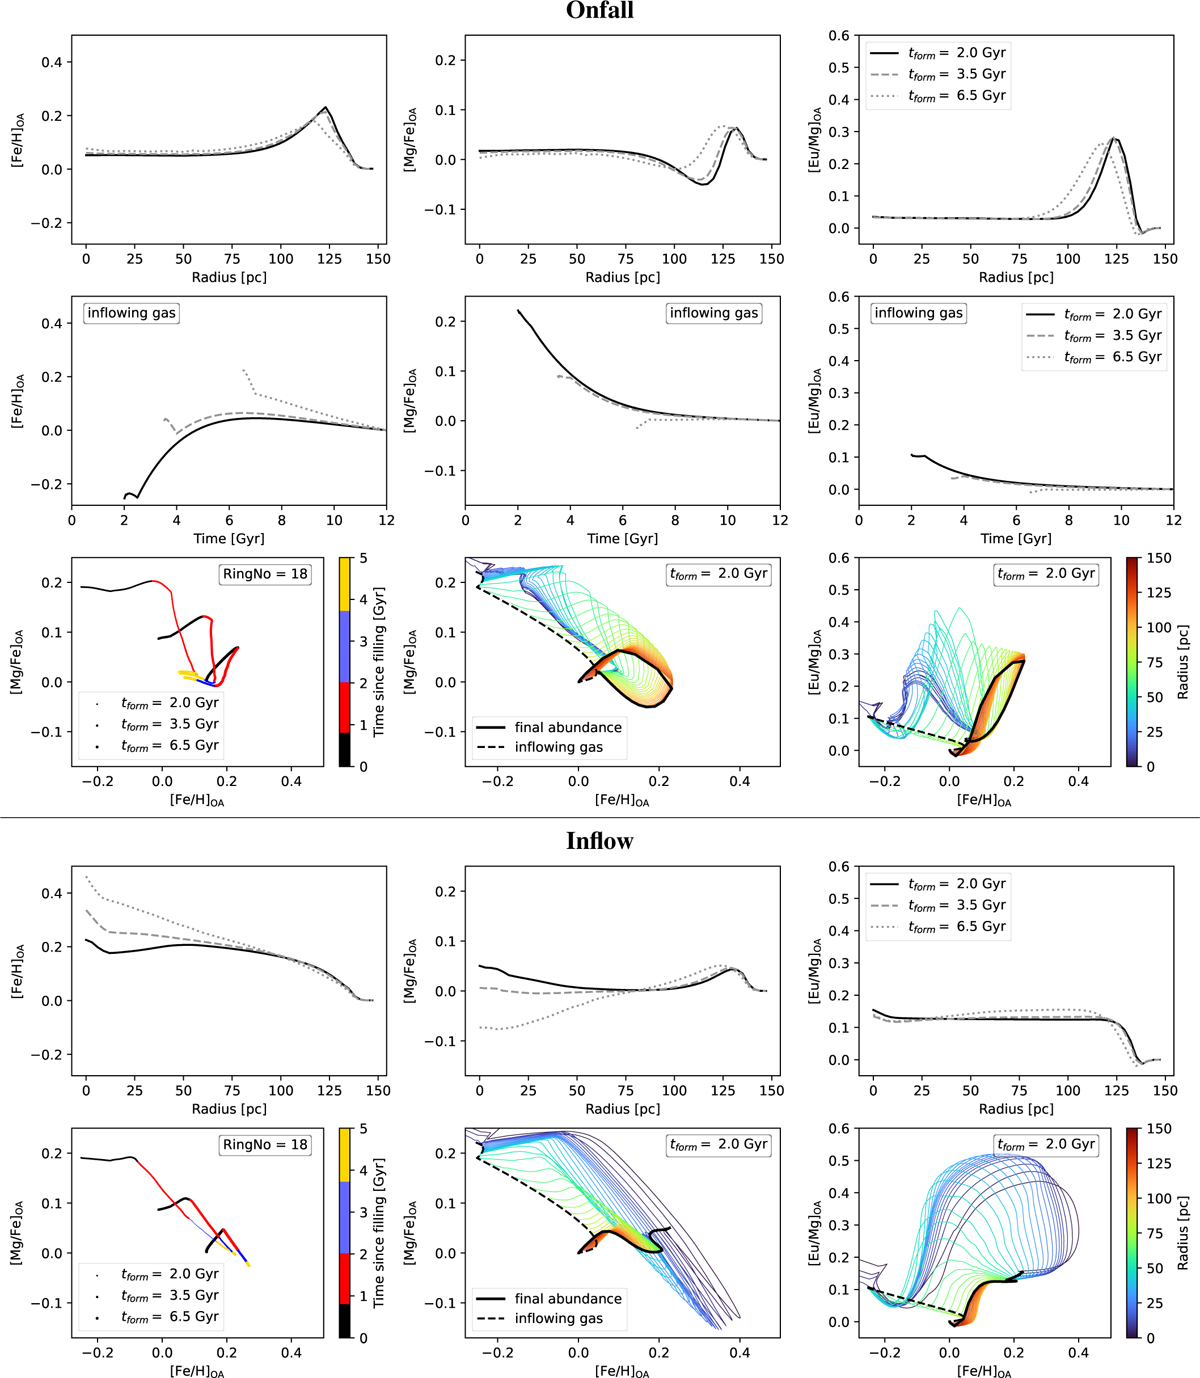
Fig. C.6
Download original image
Following Fig. 6 and 7, we show the influence of an earlier/later bar formation epoch on the NSD gas chemical evolution. The middle row of the onfall scenario shows the overabundance of the gas feeding the NSD and is the same for both models. The bottom middle and right panel hereby focus on an early bar formation time. The bottom left overlays the evolution of a single ring (at R = 55.5 pc) for all three considered formation epochs.
Current usage metrics show cumulative count of Article Views (full-text article views including HTML views, PDF and ePub downloads, according to the available data) and Abstracts Views on Vision4Press platform.
Data correspond to usage on the plateform after 2015. The current usage metrics is available 48-96 hours after online publication and is updated daily on week days.
Initial download of the metrics may take a while.