Fig. 6
Download original image
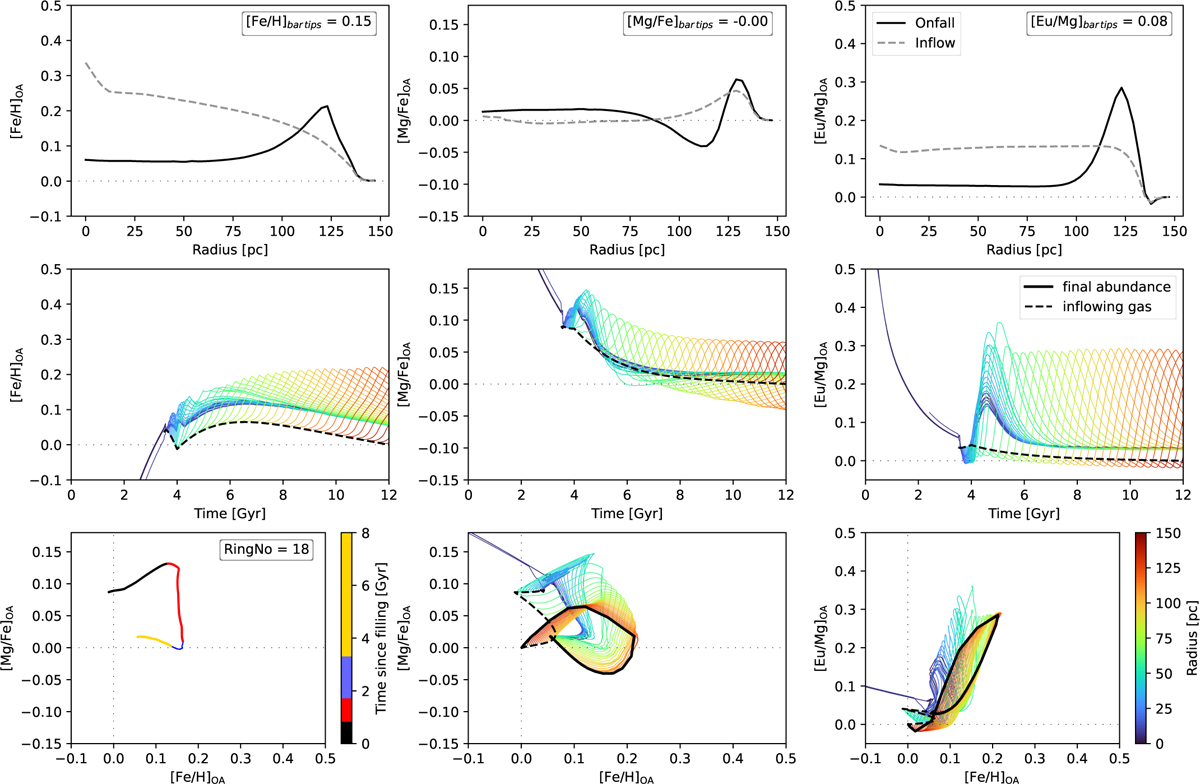
Onfall scenario. Top row: gas overabundance profiles in the NSD for [Fe/H]OA, [Mg/Fe]OA, and [Eu/Mg]OA for our fiducial model in the onfall scenario (black solid line). The overabundance is calculated as the difference between the abundance at each radius in the NSD and the abundance just outside the gas-depleted bar region. For comparison, we also show the abundance profile of the competing inflow accretion history treated in Fig. 7 (grey dashed line). We also added the final abundances at the tips of the bar, which are used for the calculation of the overabundance to the plots. Middle row: general evolution of elemental overabundances in the cold gas over time. The lines following each ring are plotted once the mass of the ring exceeds 4 × 10⁶ M⊙. The dashed line shows the abundance of the accreted gas over time.Bottom row: middle and right panels give the relative abundance plane for magnesium over iron and europium over magnesium, respectively. The final abundance is drawn in solid black and the abundance of the accreted gas as a dashed line. The leftmost panel shows the magnesium abundance plane again, but only for ring 18 at R = 55.5 pc. The timescale is adjusted to start once this ring receives gas from the outer galaxy at t = 4 Gyr.
Current usage metrics show cumulative count of Article Views (full-text article views including HTML views, PDF and ePub downloads, according to the available data) and Abstracts Views on Vision4Press platform.
Data correspond to usage on the plateform after 2015. The current usage metrics is available 48-96 hours after online publication and is updated daily on week days.
Initial download of the metrics may take a while.