Fig. 10
Download original image
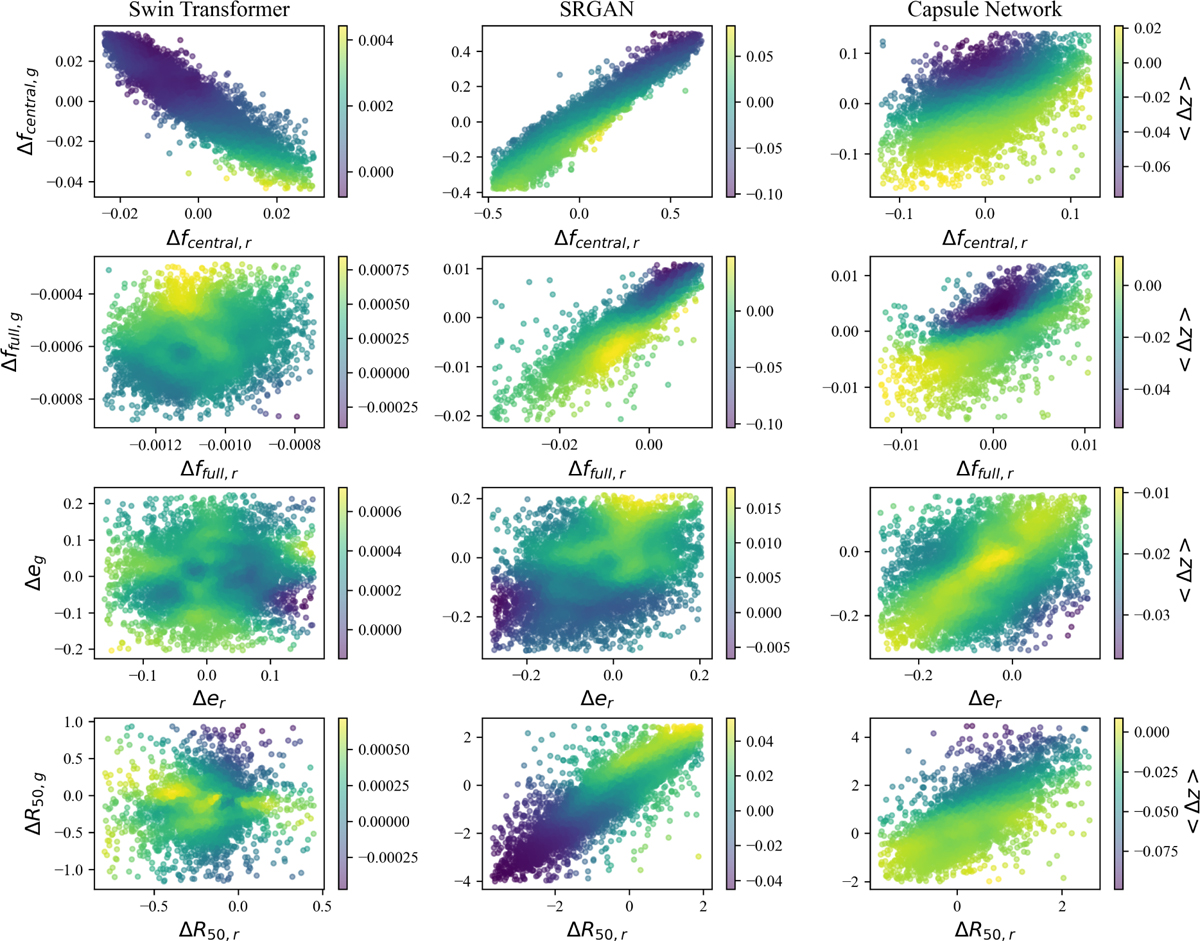
Analysis of redshift dependences on flux and galaxy property residuals using the S2S translated ɡ-band and r-band images and original SDSS validation images. First row: Mean central flux residuals between the generated and original validation images in ɡ band as a function of the residuals in r band, shown for the Swin Transformer, the SRGAN, and the capsule network. The fluxes (rescaled with Eq. (1)) are shown in the natural logarithmic scale. All the data points are color coded with the local mean difference between the redshift predictions for the generated and original SDSS validation images by a redshift estimation model trained with the original SDSS ɀ-training images. The colors are smoothed using the LOESS method from Cappellari et al. (2013). Second row: Same as the first row, but shown for the mean fluxes over the full images. Third row: Same as the first row, but shown for the ellipticity e. Fourth row: Same as the first row, but shown for the half-light radius R50.
Current usage metrics show cumulative count of Article Views (full-text article views including HTML views, PDF and ePub downloads, according to the available data) and Abstracts Views on Vision4Press platform.
Data correspond to usage on the plateform after 2015. The current usage metrics is available 48-96 hours after online publication and is updated daily on week days.
Initial download of the metrics may take a while.