Fig. A.4
Download original image
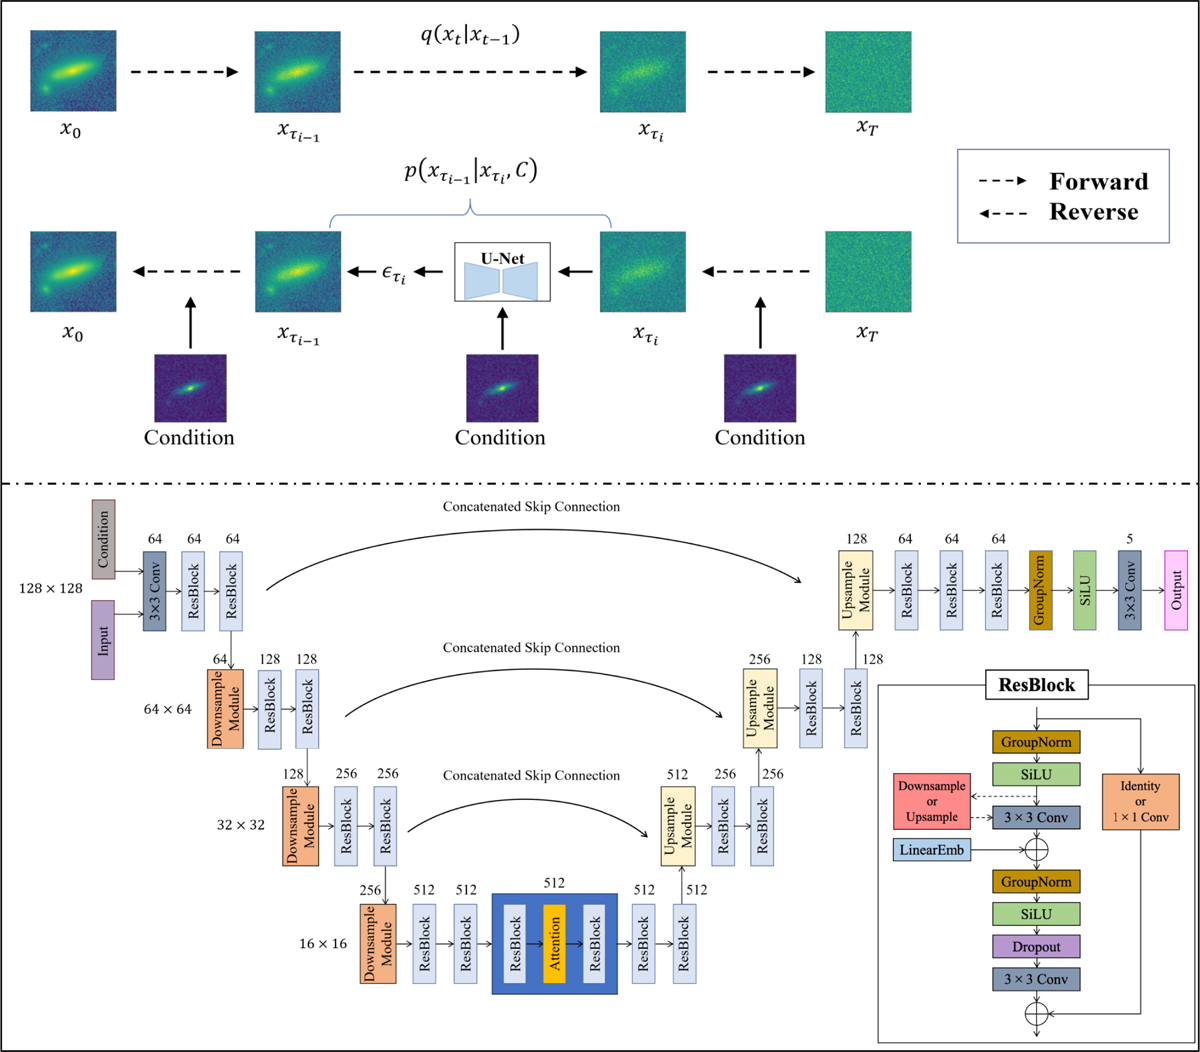
Illustration of the diffusion model for the S2C translation. Upper panel: Schematic illustration of the forward and reverse (generative) processes. The forward process corrupts the original target CFHTLS images from x0 to xT with Gaussian noise, where T is the total number of diffusion steps (T = 1000 in this work). Each step is represented by q(xt\xt−1). The generative process takes a sub-sequence from the T steps, in which each step is represented by ![]() where C represents the conditions (i.e. the SDSS images upsampled to 128 × 128 resolution via bicubic interpolation). It is realized via a U-Net that is fed with
where C represents the conditions (i.e. the SDSS images upsampled to 128 × 128 resolution via bicubic interpolation). It is realized via a U-Net that is fed with ![]() and C. The U-Net outputs a noise image,
and C. The U-Net outputs a noise image, ![]() , and
, and ![]() is used to construct
is used to construct ![]() . Through this iterative process, the noise-like images xT can be gradually denoised and approximate the target images x0 given the conditions C. Lower panel: Architecture of the U-Net. It mainly consists of residual blocks (ResBlocks), downsample modules, upsample modules, and a self-attention block. The first and the last layers of the U-Net are both convolutional layers with 3 × 3 kernels, 1 × 1 strides, and the “same” padding. A residual block (shown in the bottom-right corner) consists of group normalization (GroupNorm) operations, the sigmoid linear Unit (SiLU) activation, two 3 × 3 convolutional layers, a linear embedding, a dropout layer (with a dropout ratio of 0.2), and a skip connection. The linear embedding is applied for encoding the noise level that is used to corrupt the images. The skip connection is realized by a 1 × 1 convolution if the input and the output of the residual block do not have the same number of channels. The spatial dimensions of the input and the output are the same if neither downsampling nor upsampling is applied in the residual block. On the other hand, a downsample module has the same structure as a residual block but a 2 × 2 average pooling layer is implemented before the first 3 × 3 convolution. An upsample module contains two residual blocks, the second of which applies nearest neighbor interpolation before the first 3 × 3 convolution. Viewing the whole U-Net, the inputs of the first 12 residual blocks or downsample modules are also fed into the last 12 residual blocks or upsample modules in one-to-one correspondence in reverse order (via concatenation), as indicated by the curved arrows. The spatial dimensions of the outputs of all the blocks in each row remain the same. They are indicated by the numbers on the left of the rows. The number next to each block stands for the number of its output channels.
. Through this iterative process, the noise-like images xT can be gradually denoised and approximate the target images x0 given the conditions C. Lower panel: Architecture of the U-Net. It mainly consists of residual blocks (ResBlocks), downsample modules, upsample modules, and a self-attention block. The first and the last layers of the U-Net are both convolutional layers with 3 × 3 kernels, 1 × 1 strides, and the “same” padding. A residual block (shown in the bottom-right corner) consists of group normalization (GroupNorm) operations, the sigmoid linear Unit (SiLU) activation, two 3 × 3 convolutional layers, a linear embedding, a dropout layer (with a dropout ratio of 0.2), and a skip connection. The linear embedding is applied for encoding the noise level that is used to corrupt the images. The skip connection is realized by a 1 × 1 convolution if the input and the output of the residual block do not have the same number of channels. The spatial dimensions of the input and the output are the same if neither downsampling nor upsampling is applied in the residual block. On the other hand, a downsample module has the same structure as a residual block but a 2 × 2 average pooling layer is implemented before the first 3 × 3 convolution. An upsample module contains two residual blocks, the second of which applies nearest neighbor interpolation before the first 3 × 3 convolution. Viewing the whole U-Net, the inputs of the first 12 residual blocks or downsample modules are also fed into the last 12 residual blocks or upsample modules in one-to-one correspondence in reverse order (via concatenation), as indicated by the curved arrows. The spatial dimensions of the outputs of all the blocks in each row remain the same. They are indicated by the numbers on the left of the rows. The number next to each block stands for the number of its output channels.
Current usage metrics show cumulative count of Article Views (full-text article views including HTML views, PDF and ePub downloads, according to the available data) and Abstracts Views on Vision4Press platform.
Data correspond to usage on the plateform after 2015. The current usage metrics is available 48-96 hours after online publication and is updated daily on week days.
Initial download of the metrics may take a while.