Open Access
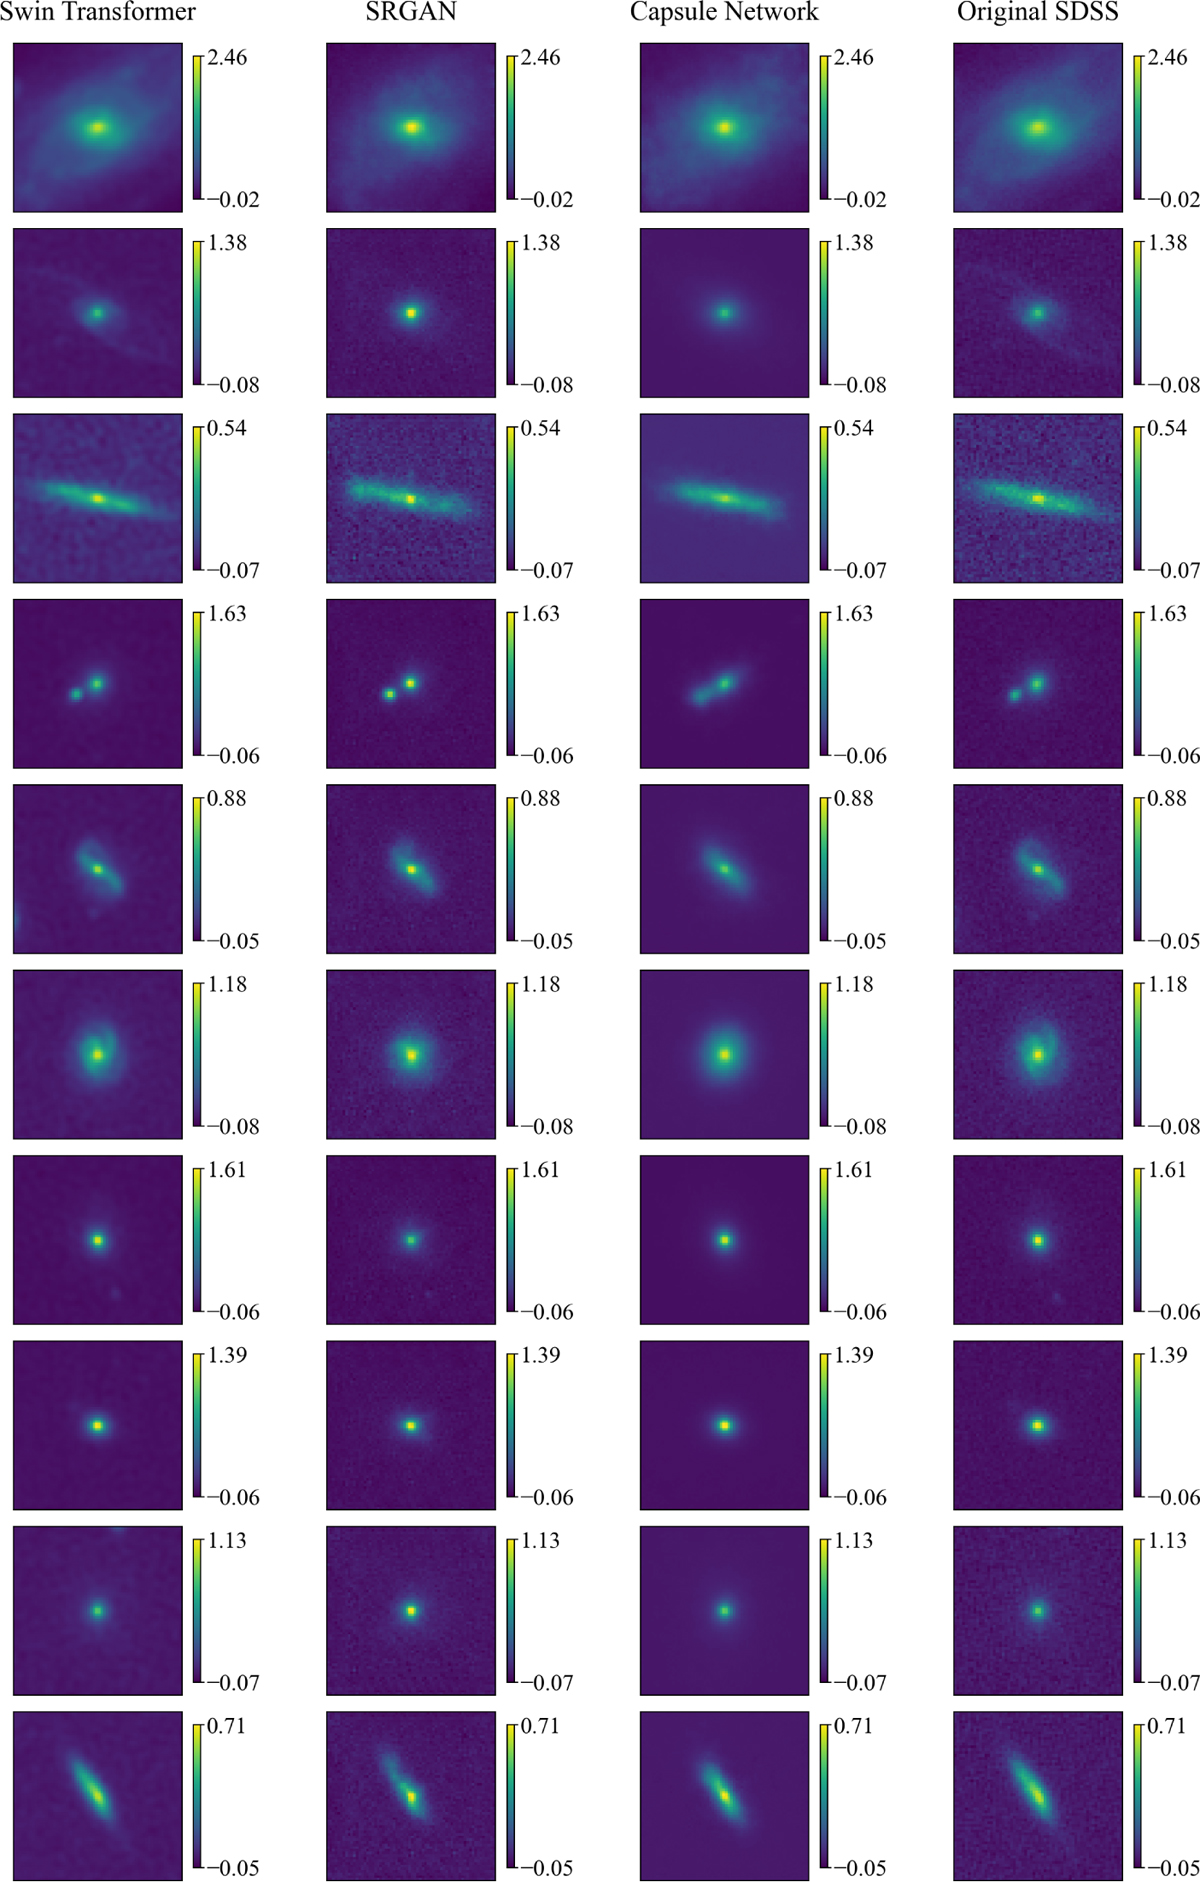
Fig. 2
Download original image
Exemplar r-band images generated by the S2S translation models (i.e. the Swin Transformer, the SRGAN, and the capsule network) and the corresponding original SDSS validation images. The color bar next to each image indicates the rescaled flux (Eq. (1)) in the natural logarithmic scale.
Current usage metrics show cumulative count of Article Views (full-text article views including HTML views, PDF and ePub downloads, according to the available data) and Abstracts Views on Vision4Press platform.
Data correspond to usage on the plateform after 2015. The current usage metrics is available 48-96 hours after online publication and is updated daily on week days.
Initial download of the metrics may take a while.