Fig. 5
Download original image
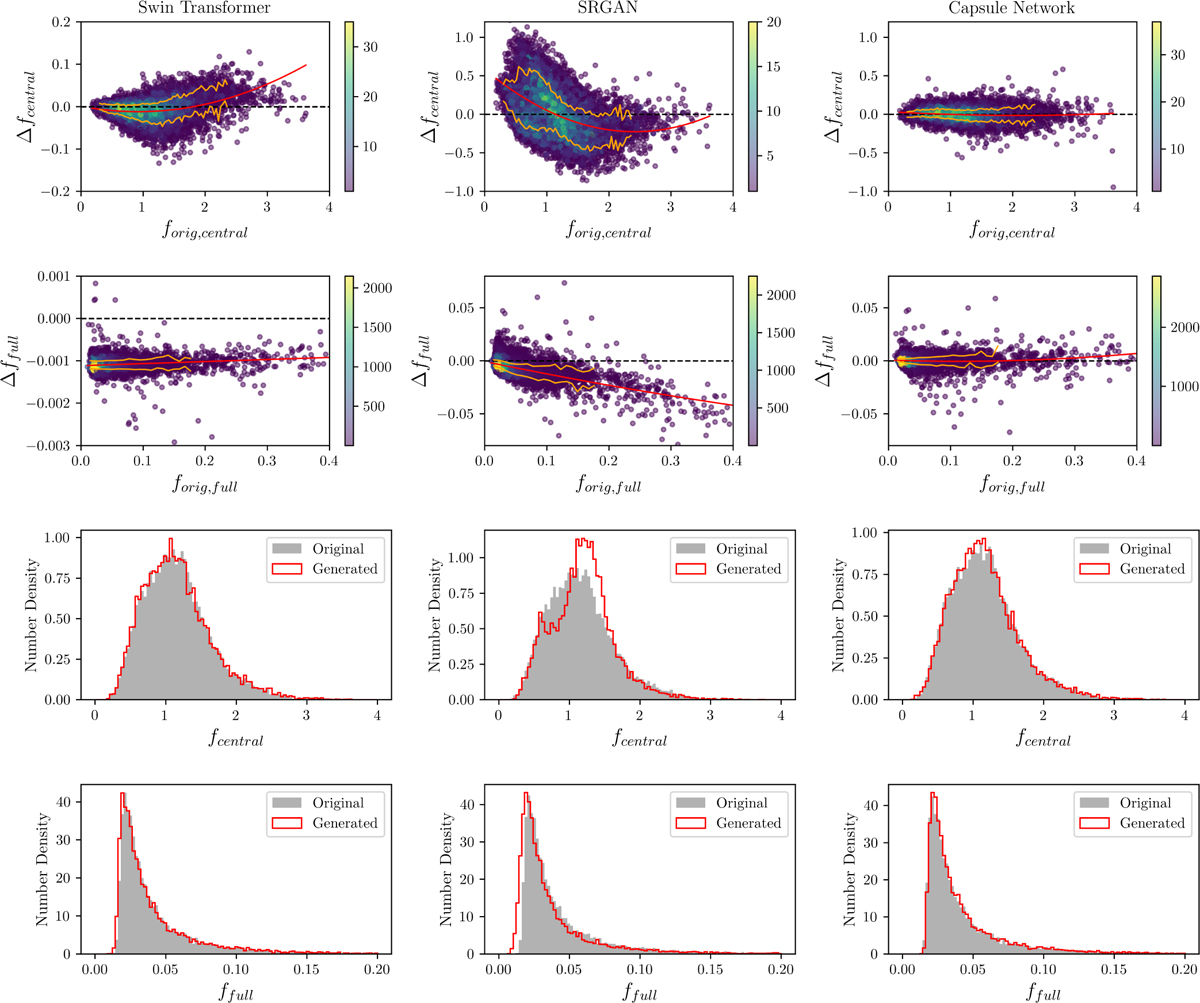
Comparison on flux intensities between the S2S translated r-band images and original SDSS validation images. The fluxes (rescaled with Eq. (1)) are shown in the natural logarithmic scale. First row: Mean central flux residuals (estimated over the four central pixels) between the generated and original r-band images as a function of the mean central fluxes of the original images, shown for the Swin Transformer, the SRGAN, and the capsule network. In each panel, the orange curves indicate the 16th and 84th percentiles of the flux residuals at each flux level, the red curve indicates the linear or quadratic fit, and the black dashed line indicates zero residuals. All the data points are color coded with the relative number density. Second row: Same as the first row, but with the mean fluxes over the full r-band images. Third row: Mean central flux distributions for the generated and original images. Fourth row: Same as the third row, but with the mean full-image fluxes.
Current usage metrics show cumulative count of Article Views (full-text article views including HTML views, PDF and ePub downloads, according to the available data) and Abstracts Views on Vision4Press platform.
Data correspond to usage on the plateform after 2015. The current usage metrics is available 48-96 hours after online publication and is updated daily on week days.
Initial download of the metrics may take a while.