Fig. 4
Download original image
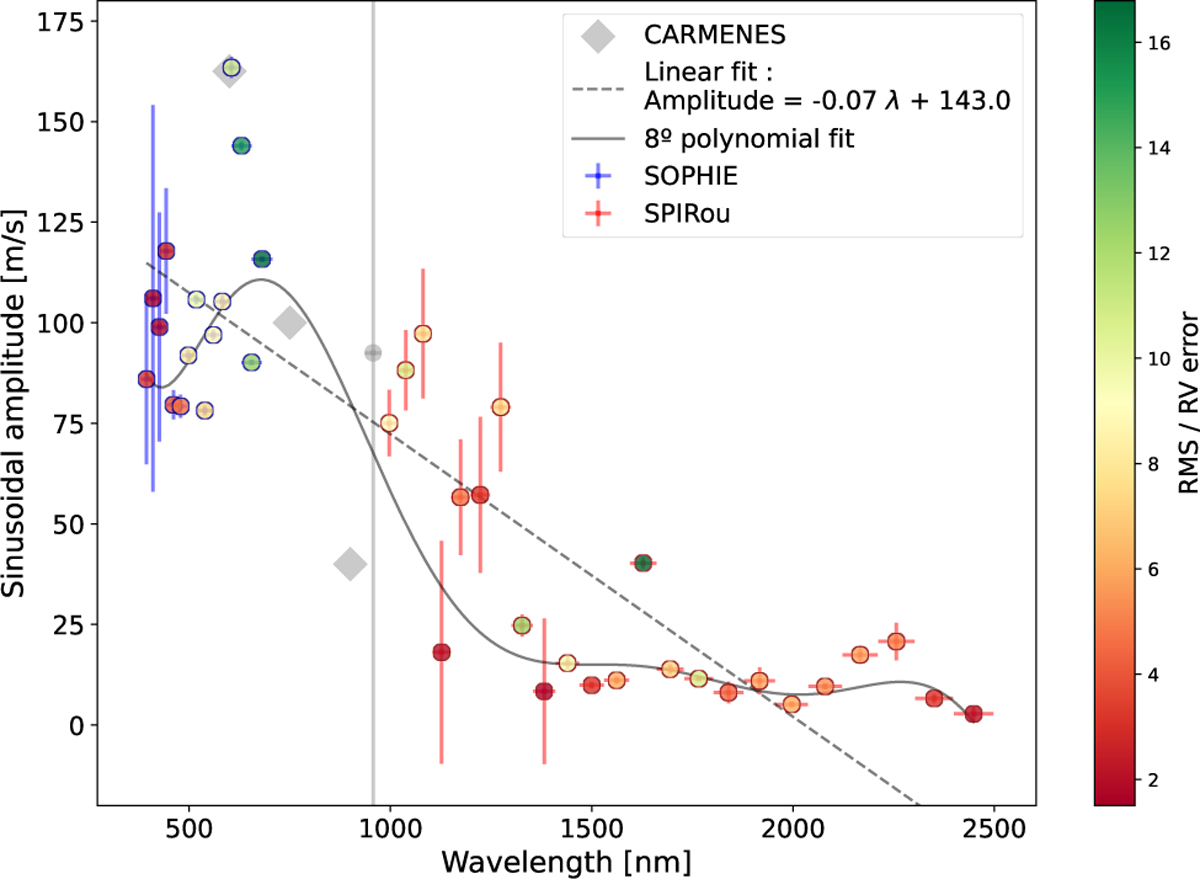
EV Lac’s chromaticity plot, showing the amplitude of the activity signal for each wavelength bin, from the SOPHIE to the SPIRou ranges. The dotted line is a linear fit, related to the CRX, while the 8th degree polynomial fit is used as a visual aid to illustrate the trend, which can be compared to the predictions of Barnes et al. (2011). The colour bar shows the RMS over the mean RV error. The first bin of the SPIRou dataset is shown in grey and has been removed from the fit due to its very high amplitude uncertainty and very low RMS/RV error. The detail of the sinusoïdal fit for each point can be found in Appendix C. The three diamond-shaped grey points extracted from the linear fit in Figure 3 of Jeffers et al. (2022) are included here simply for comparison purposes, as they were not observed at the same epochs.
Current usage metrics show cumulative count of Article Views (full-text article views including HTML views, PDF and ePub downloads, according to the available data) and Abstracts Views on Vision4Press platform.
Data correspond to usage on the plateform after 2015. The current usage metrics is available 48-96 hours after online publication and is updated daily on week days.
Initial download of the metrics may take a while.