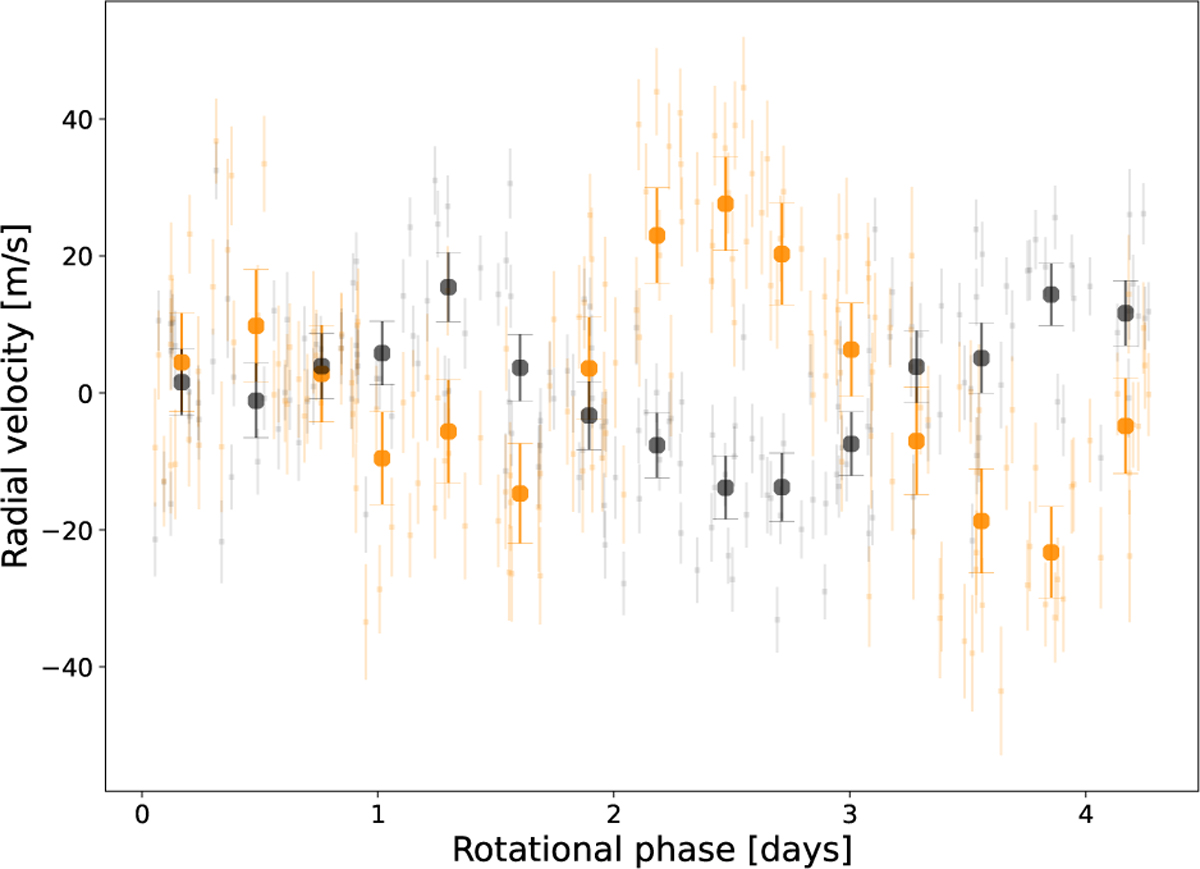
Fig. 8
Download original image
RV time series phase-folded on the rotation period (4.36 days), comparing contrasted and anti-contrasted lines. Time series using 7180 lines with C>1.05, which behave similarly to a “regular spot” that hides a part of the photosphere, shown in black (RMS = 13.7m/s). Time series using 9464 lines with C<0.95, which behave similarly to an “anti-contrasted spot”, adding more spectral information than the photosphere, shown in yellow (RMS = 19.1 m/s).
Current usage metrics show cumulative count of Article Views (full-text article views including HTML views, PDF and ePub downloads, according to the available data) and Abstracts Views on Vision4Press platform.
Data correspond to usage on the plateform after 2015. The current usage metrics is available 48-96 hours after online publication and is updated daily on week days.
Initial download of the metrics may take a while.