Fig. 9
Download original image
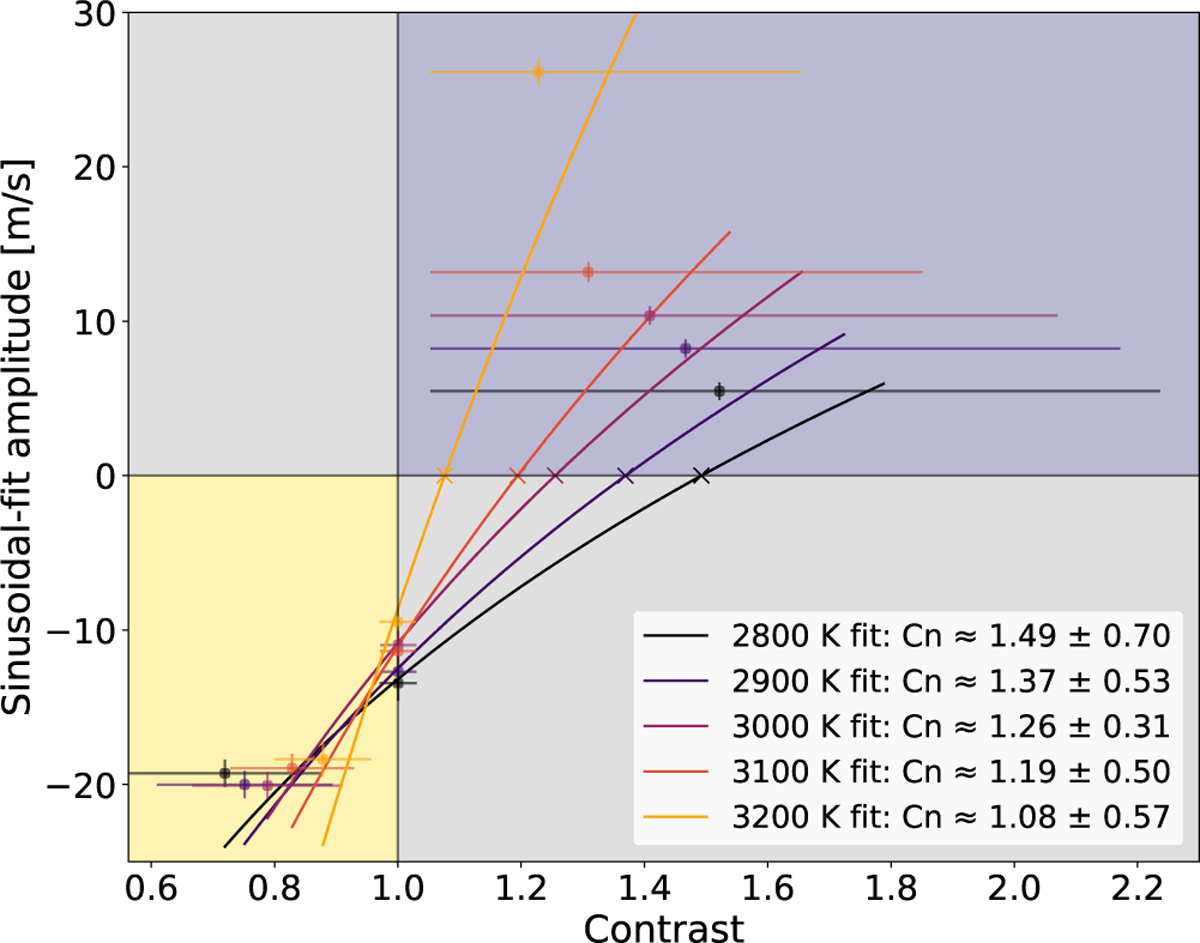
Evolution of the sinusoidal fit amplitude for RV time series computed using spectral lines in different contrast regimes, for a photosphere at 3300 Κ and different spot temperatures. The sign of the amplitude gives the phase of the signal (Negative ⇒ anti-contrast phase, Positive ⇒ regular contrast phase). Contrast values are computed as the mean of per-line contrasts within each regime, with standard deviations as uncertainties. For each temperature, a linear fit in log(contrast) space is used to determine the effective neutral contrast Cn, namely, the contrast at which the signal amplitude is expected to vanish. Region corresponding to time series exhibiting an anti-contrast phase, shown in yellow. Region corresponding to time series with a regular-contrast phase, shown in blue. Areas indicating regions where the time series should not appear if the spectra from the spot and the photosphere were perfectly modeled, shown in gray.
Current usage metrics show cumulative count of Article Views (full-text article views including HTML views, PDF and ePub downloads, according to the available data) and Abstracts Views on Vision4Press platform.
Data correspond to usage on the plateform after 2015. The current usage metrics is available 48-96 hours after online publication and is updated daily on week days.
Initial download of the metrics may take a while.