Fig. 10.
Download original image
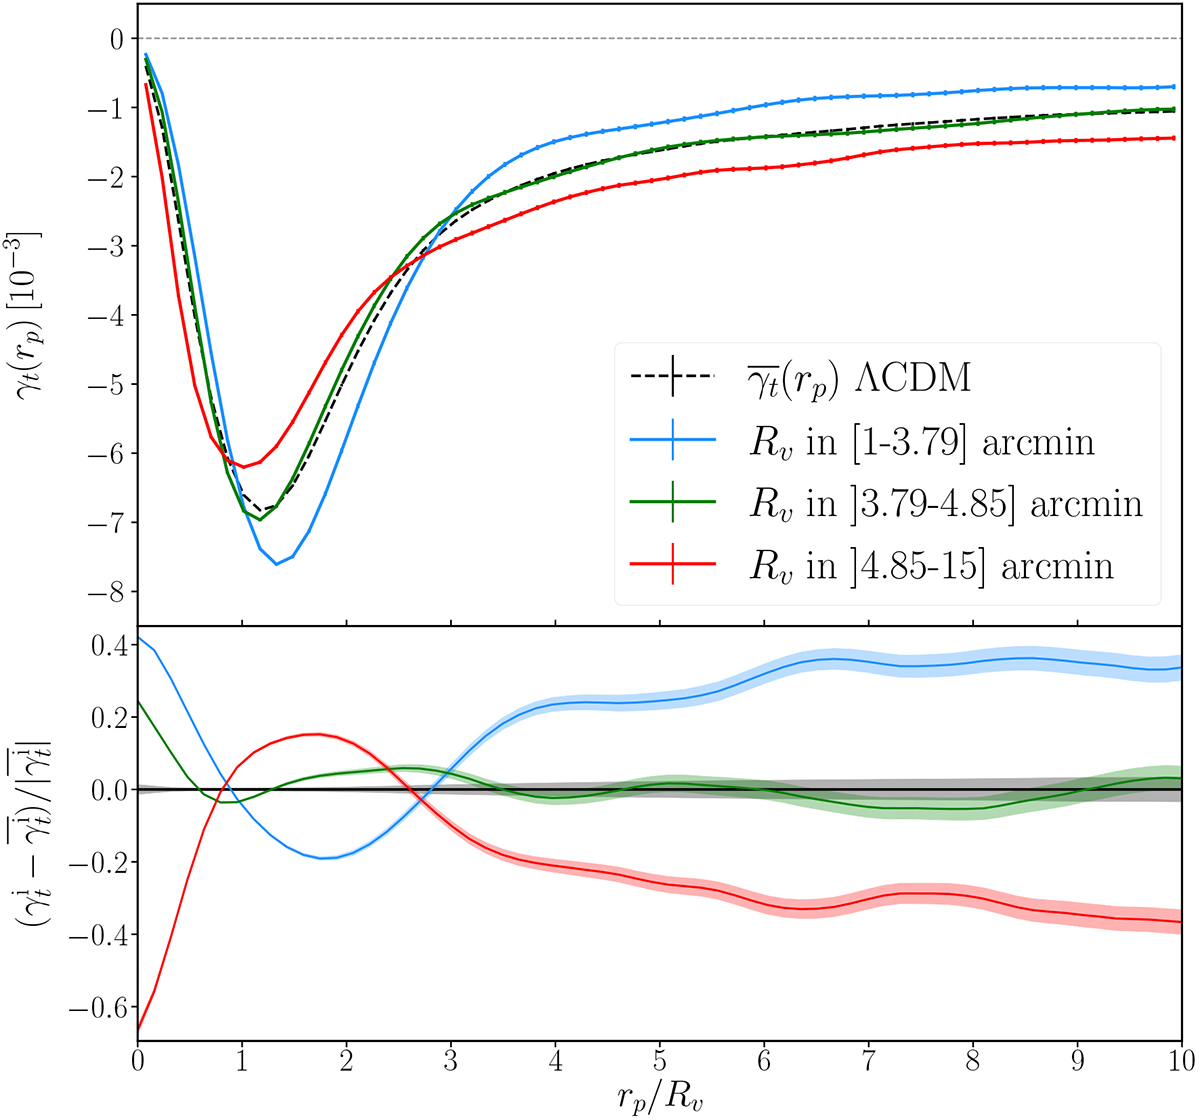
Top panel: Averaged tangential shear profiles measured from samples of voids with different sizes in the standard ΛCDM cosmology: small (in light-blue), medium (green) and large (red). We report with a black dashed line the one computed using the whole void sample. Bottom panel: Residuals between the profiles of each radius selection and the stacked void profile relative to the full sample. The shaded regions with same colors around the curves represent the uncertainty associated with the measures, analogously to Fig. 9.
Current usage metrics show cumulative count of Article Views (full-text article views including HTML views, PDF and ePub downloads, according to the available data) and Abstracts Views on Vision4Press platform.
Data correspond to usage on the plateform after 2015. The current usage metrics is available 48-96 hours after online publication and is updated daily on week days.
Initial download of the metrics may take a while.