Fig. 12.
Download original image
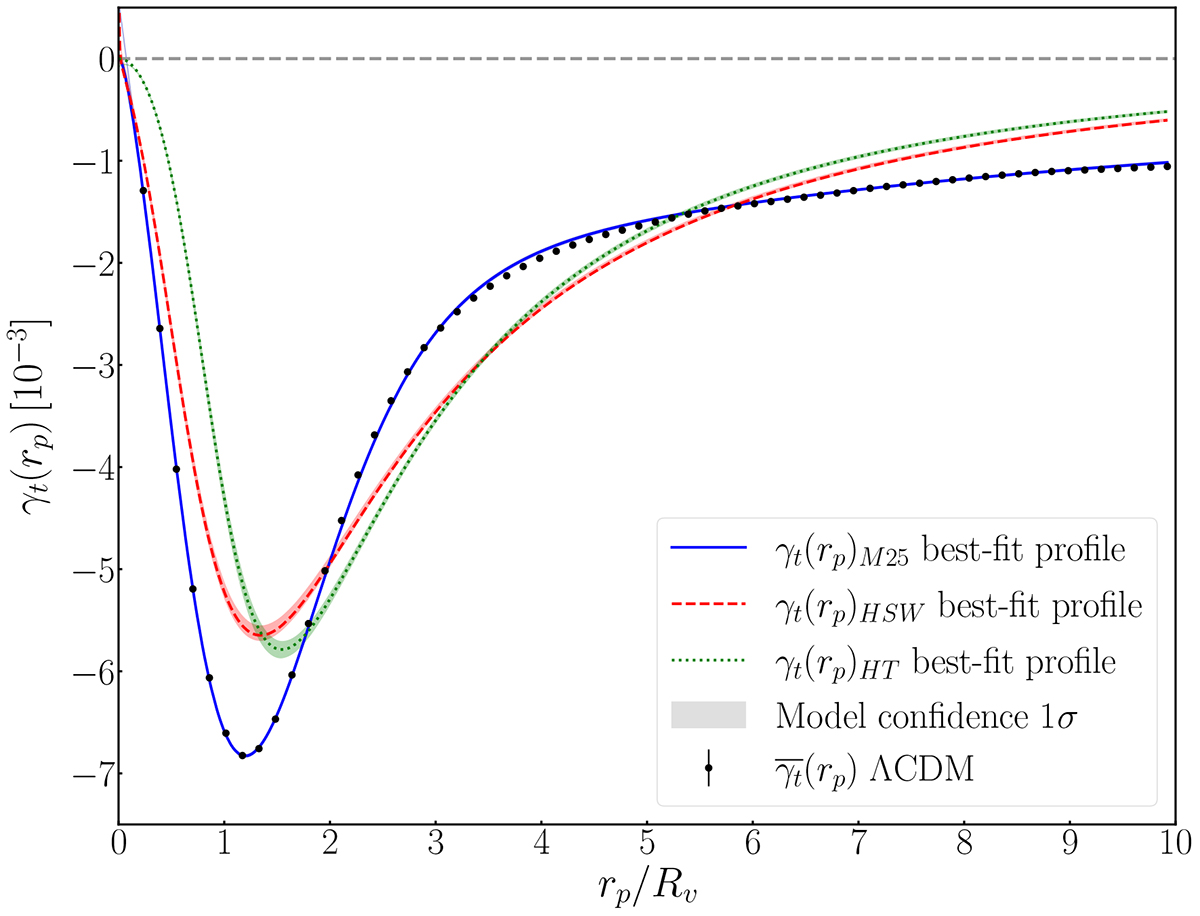
Best fits of the averaged stacked tunnel voids tangential shear profiles, γt(rp), measured in ΛCDM cosmology adopting three different parametric functions. The data are derived as the mean of the 256 ΛCDM mock light cones and represented with black markers having error bars computed as specified in Sect. 5.2. The first two models considered are derived from the line-of-sight integration of two 3D void density profile functions: HSW (red dashed line) and HT (green dotted line). The last one is the new formula developed in this work for WL tunnel voids (blue solid line), reported in Eq. (34). The shaded area, in some cases barely visible, represents the 1σ uncertainty associated with each fit.
Current usage metrics show cumulative count of Article Views (full-text article views including HTML views, PDF and ePub downloads, according to the available data) and Abstracts Views on Vision4Press platform.
Data correspond to usage on the plateform after 2015. The current usage metrics is available 48-96 hours after online publication and is updated daily on week days.
Initial download of the metrics may take a while.