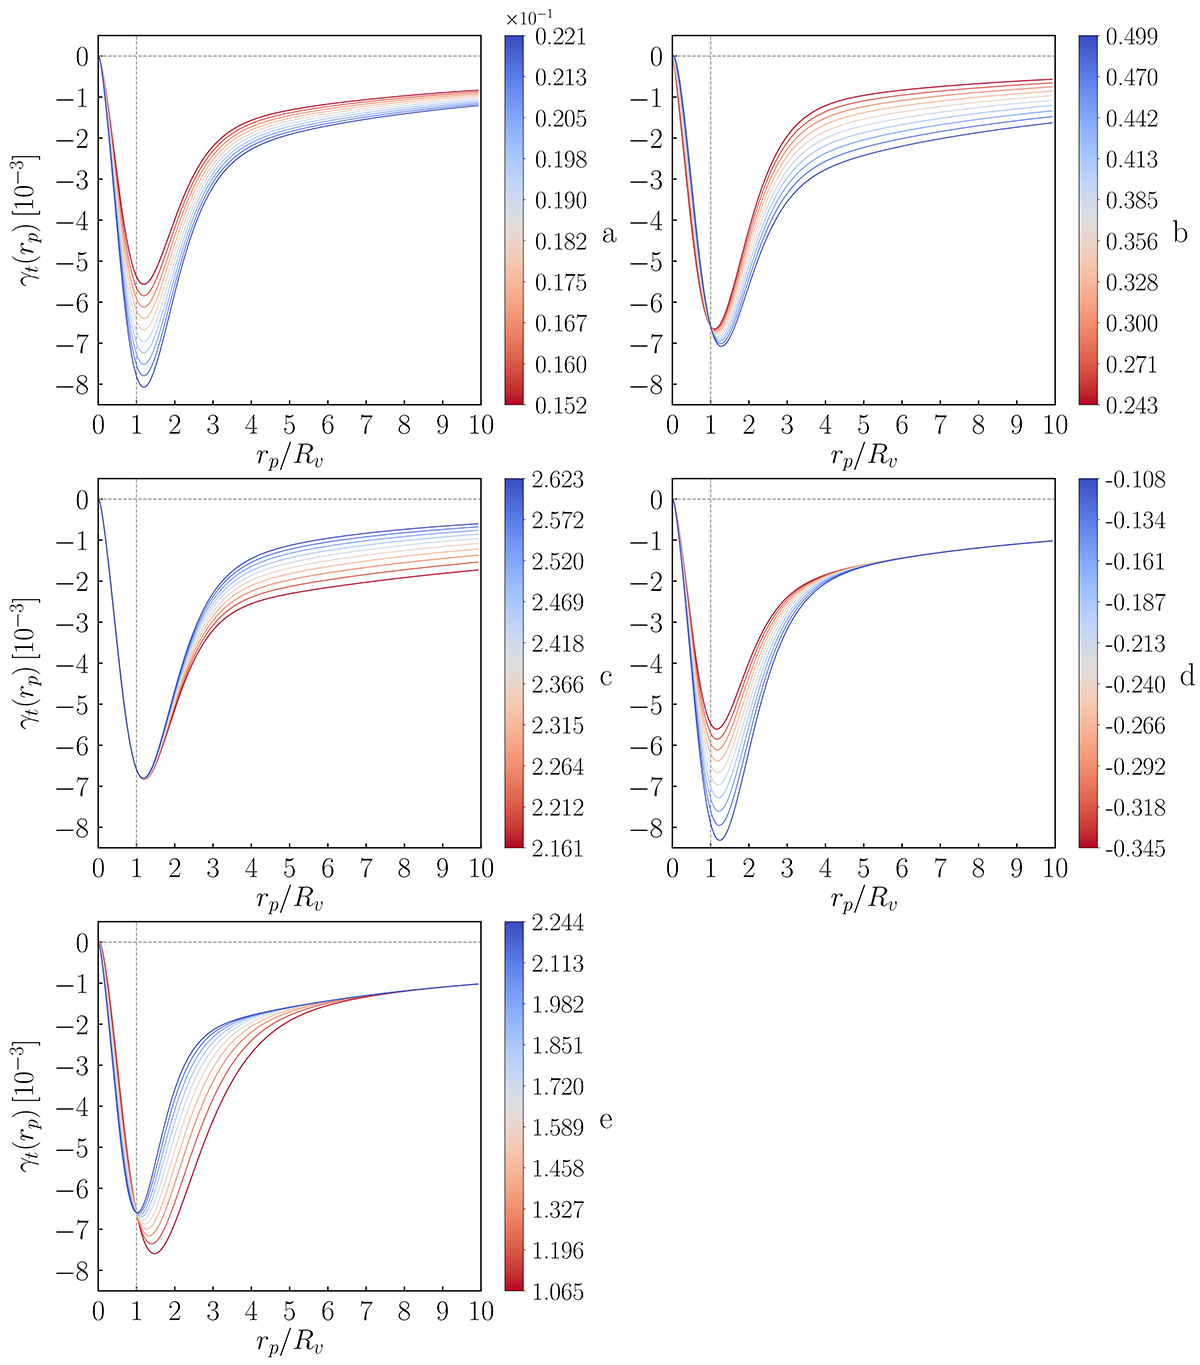
Fig. B.1.
Download original image
Effects of varying individually the coefficients of the function reported in Eq. (34). For each parameter, ten curves are represented and colored according to the value of the selected parameter. The colorbar located on the right of each subplot shows the association of the color used with the parameter value. The different panels refer to the parameters a (top left), b (top right), c (central left), d (central right), and e (bottom left).
Current usage metrics show cumulative count of Article Views (full-text article views including HTML views, PDF and ePub downloads, according to the available data) and Abstracts Views on Vision4Press platform.
Data correspond to usage on the plateform after 2015. The current usage metrics is available 48-96 hours after online publication and is updated daily on week days.
Initial download of the metrics may take a while.