Fig. 7.
Download original image
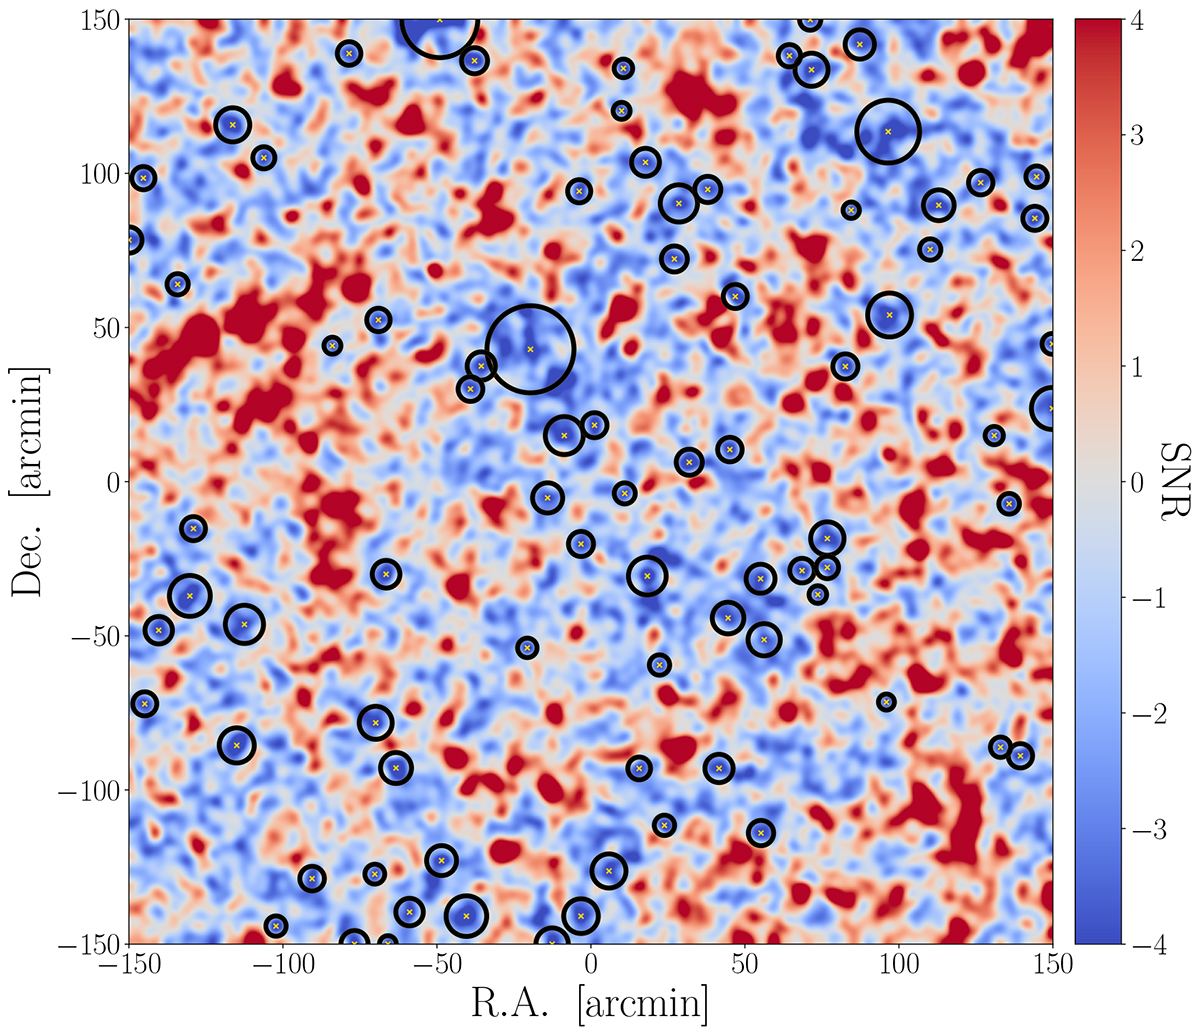
Example of the final tunnels catalog associated with the same S/N map of Fig. 2 and Fig. 6. Colors from blue to red represent areas with increasing S/N, as indicated by the colorbar on the right. The 2D voids identified by our algorithm are shown as areas delimited by black circles. The corresponding centers (absolute minima) are marked with yellow crosses.
Current usage metrics show cumulative count of Article Views (full-text article views including HTML views, PDF and ePub downloads, according to the available data) and Abstracts Views on Vision4Press platform.
Data correspond to usage on the plateform after 2015. The current usage metrics is available 48-96 hours after online publication and is updated daily on week days.
Initial download of the metrics may take a while.