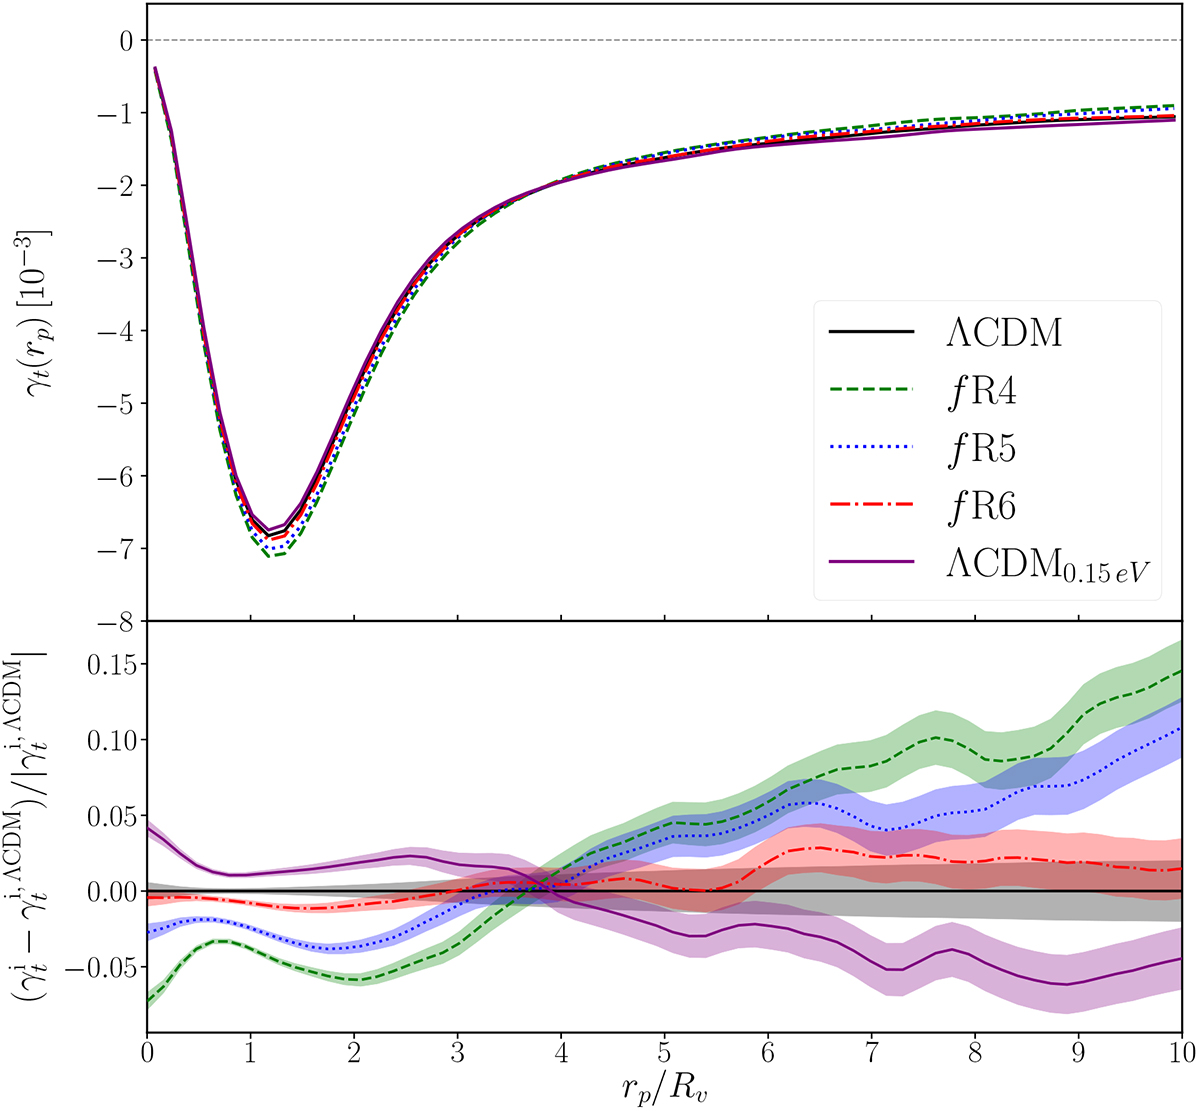
Fig. 9.
Download original image
Top panel: Averaged tangential shear profiles extracted from 256 light-cone random realizations with redshift zs = 1, for the different analyzed models. Bottom panel: Corresponding residual with respect to the profile measured in the ΛCDM scenario. Both the plots utilize the following color scheme: ΛCDM (black), fR4 (green), fR5 (blue), fR6 (red), and ΛCDM0.15 eV (purple). The shaded regions with the same colors around the curves represent the associated uncertainties, computed via the corrected covariance matrix (see Eqs. (31) and (A.2)). These are not displayed in the top panel for visualization reasons.
Current usage metrics show cumulative count of Article Views (full-text article views including HTML views, PDF and ePub downloads, according to the available data) and Abstracts Views on Vision4Press platform.
Data correspond to usage on the plateform after 2015. The current usage metrics is available 48-96 hours after online publication and is updated daily on week days.
Initial download of the metrics may take a while.