Open Access
Fig. 1.
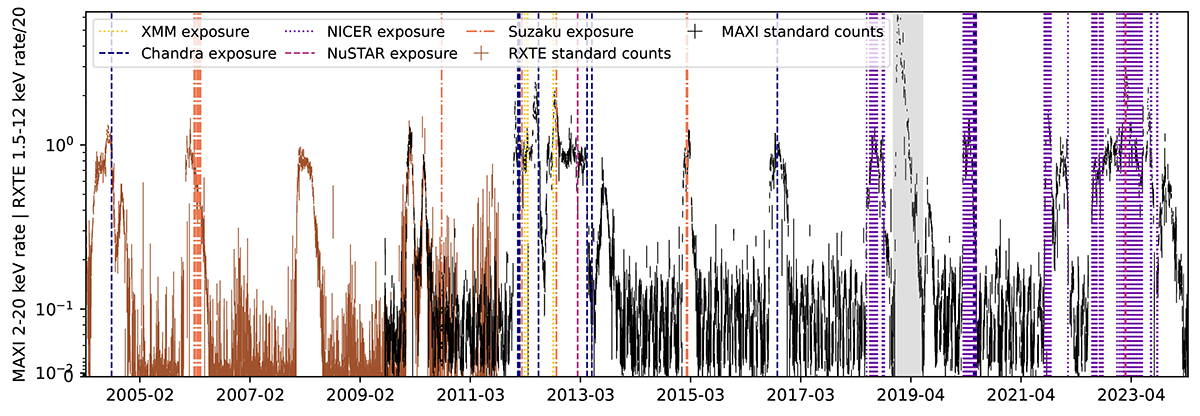
Download original image
Long-term MAXI and RXTE (normalized to MAXI) light curves of 4U 1630−47 until 2024, with exposures used for line detections highlighted by dashed vertical lines. The gray band highlights contamination by the 2018 outburst of the nearby BHB MAXI J1631-479 (Miyasaka et al. 2018).
Current usage metrics show cumulative count of Article Views (full-text article views including HTML views, PDF and ePub downloads, according to the available data) and Abstracts Views on Vision4Press platform.
Data correspond to usage on the plateform after 2015. The current usage metrics is available 48-96 hours after online publication and is updated daily on week days.
Initial download of the metrics may take a while.