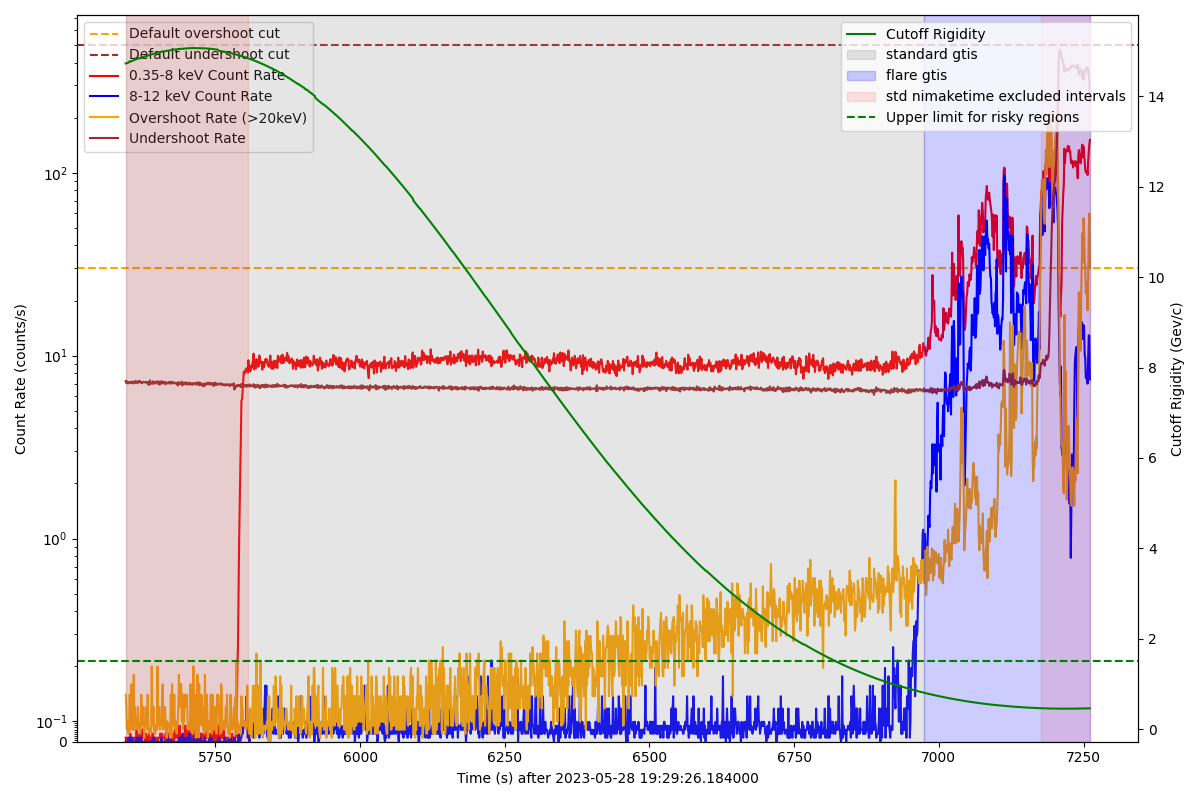
Fig. A.1.
Download original image
Diagnostic plot of several quantities stored in the NICER filter file for a single continuous GTI of ObsID 6130010118. A bright X-ray flare is easily visible at the end of the observation in the soft X-ray (bright red) and high-energy(blue) light curves. The automatic filtering (red regions) only removes a part of this flare, whereas the additional screening (blue region) removes it entirely
Current usage metrics show cumulative count of Article Views (full-text article views including HTML views, PDF and ePub downloads, according to the available data) and Abstracts Views on Vision4Press platform.
Data correspond to usage on the plateform after 2015. The current usage metrics is available 48-96 hours after online publication and is updated daily on week days.
Initial download of the metrics may take a while.