Open Access
Fig. 2.
Download original image
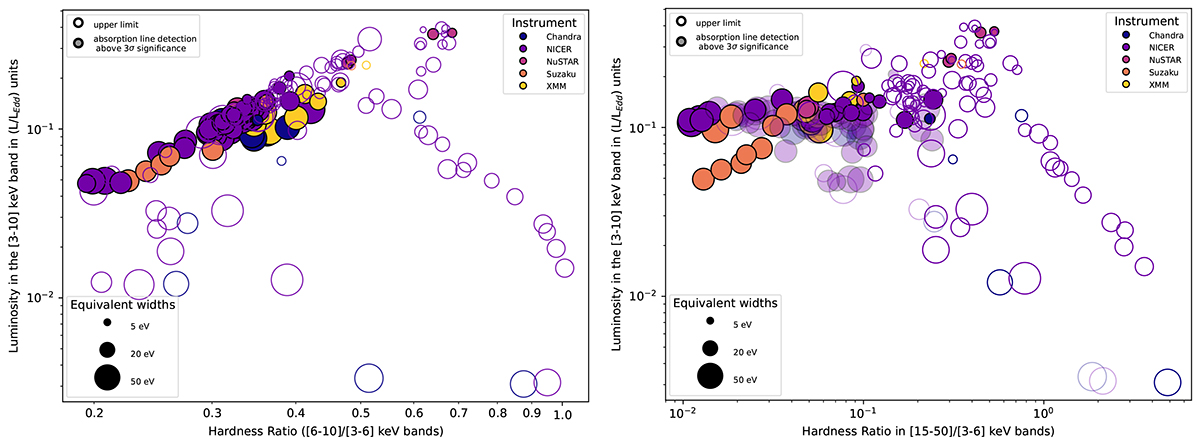
Multi-instrument “soft” (top) and “hard” (bottom) HLDs of 4U 1630−47, colored according to instruments. In the right panel, transparent markers indicate the position of 1σ HR upper limits in non-significant detections (see Appendix B for details).
Current usage metrics show cumulative count of Article Views (full-text article views including HTML views, PDF and ePub downloads, according to the available data) and Abstracts Views on Vision4Press platform.
Data correspond to usage on the plateform after 2015. The current usage metrics is available 48-96 hours after online publication and is updated daily on week days.
Initial download of the metrics may take a while.