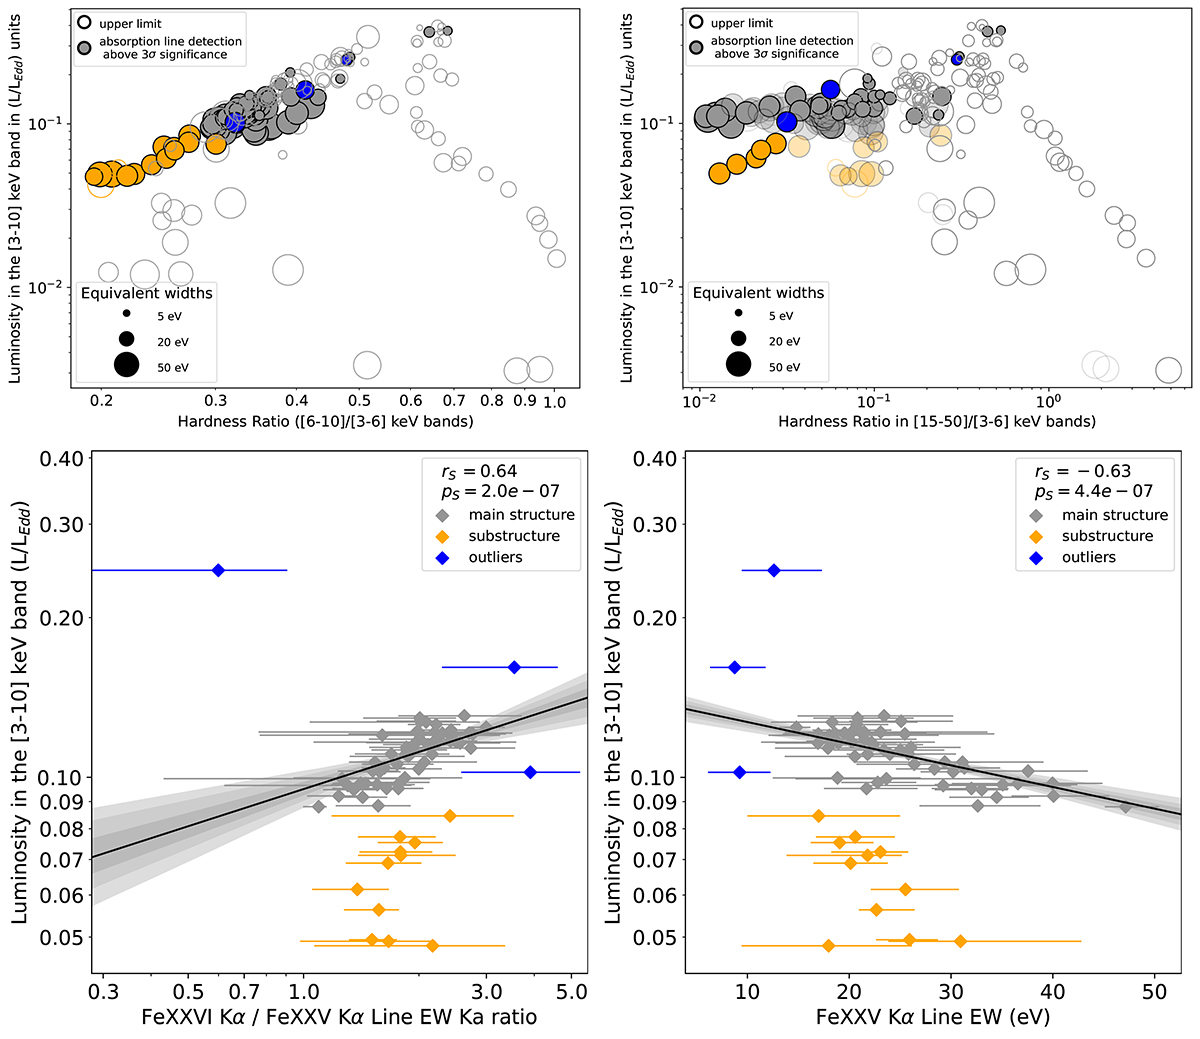
Fig. 6.
Download original image
(Top) Multi-instrument “soft” (left) and “hard” (right) HLDs of 4U 1630−47, colored according to the substructure and outliers defined in Sect. 4.2.2. (Bottom) Global scatter plots of the Fe Kα EW ratio (Left) and Fe XXV Kα EW (right) against luminosity. In the left panel, EW ratio lower limits are plotted for observations with only Fe XXVI Kα detected, and the black line and gray region show the extent of the log-log linear correlation and its 1, 2 and 3σ confidence intervals. Both these and the spearman rank are computed only from observations of the main structure (in gray).
Current usage metrics show cumulative count of Article Views (full-text article views including HTML views, PDF and ePub downloads, according to the available data) and Abstracts Views on Vision4Press platform.
Data correspond to usage on the plateform after 2015. The current usage metrics is available 48-96 hours after online publication and is updated daily on week days.
Initial download of the metrics may take a while.