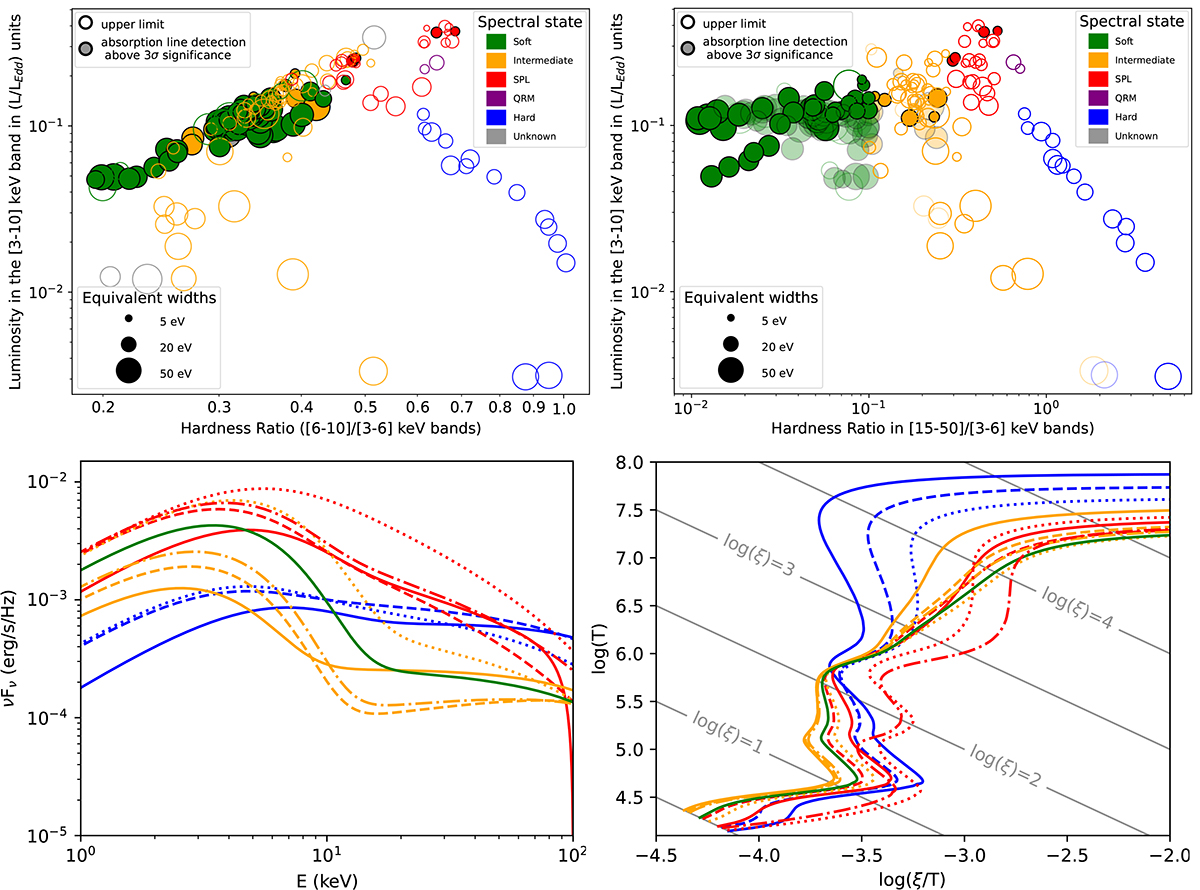
Fig. 8.
Download original image
Upper panels: Soft and Hard HLD of 4U1630−47, colored according to the spectral state. Lower panels: Unabsorbed SEDs and corresponding stability curves for a few SEDs in each state. The different SEDs in each spectral state are distinguished by line style for the sake of visualization, and ordered in 3–10 keV luminosity from full line (faintest) to fully dotted (brightest).
Current usage metrics show cumulative count of Article Views (full-text article views including HTML views, PDF and ePub downloads, according to the available data) and Abstracts Views on Vision4Press platform.
Data correspond to usage on the plateform after 2015. The current usage metrics is available 48-96 hours after online publication and is updated daily on week days.
Initial download of the metrics may take a while.