Fig. 9.
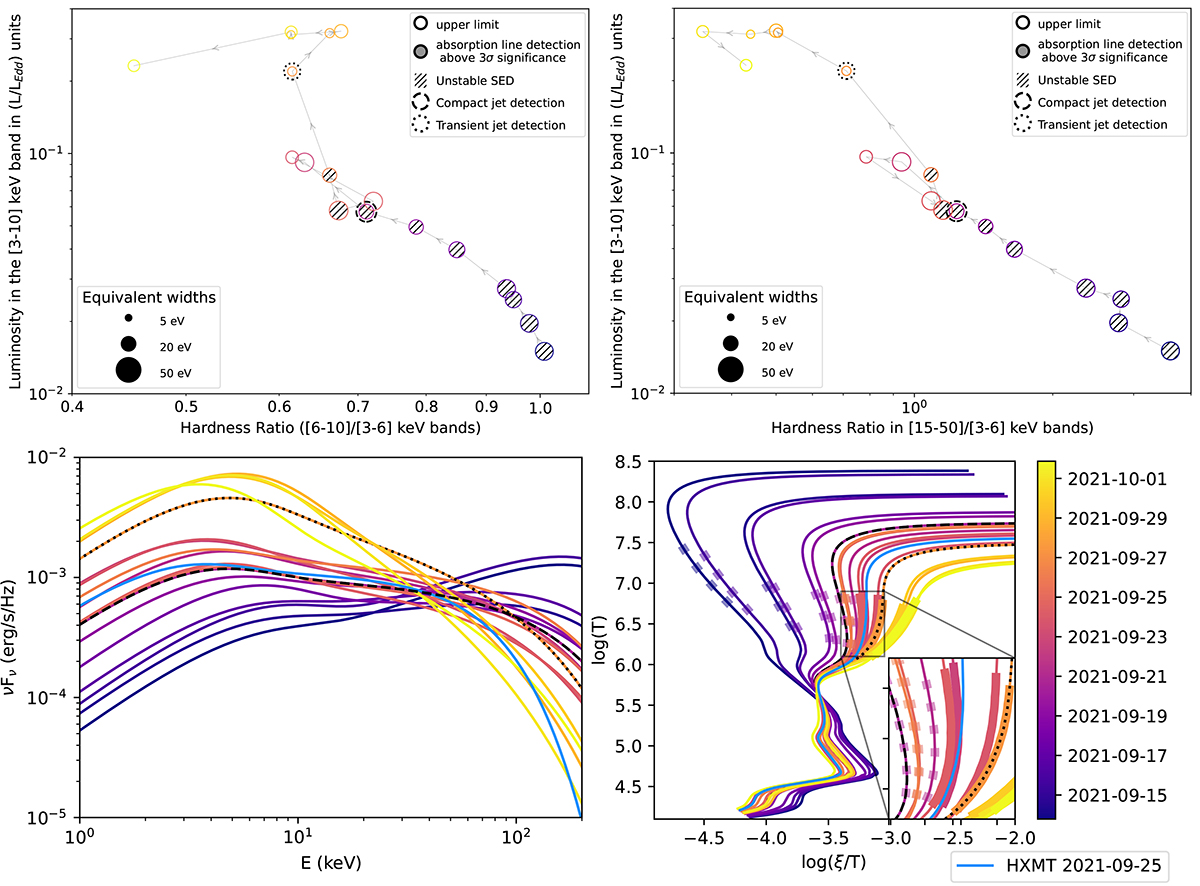
Download original image
Evolution of the beginning of the 2021 Outburst of 4U1630−47, seen in the soft (upper left) and hard (upper right) HLDs, corresponding unabsorbed SEDs (lower left), and stability curves (lower right). The regions bolded in the stability curves shows the 90% ionization range of Fe XXV Kα and Fe XXVI Kα, and are dotted when mostly unstable. In all panels, the black overplotted lines highlight when the observation occured in the presence of a hard-state compact jet (dashed) or transient radio ejecta (dotted). The light blue SED and stability curve are derived from the fit parameters of Yang et al. (2022) in their last pre-transition observation.
Current usage metrics show cumulative count of Article Views (full-text article views including HTML views, PDF and ePub downloads, according to the available data) and Abstracts Views on Vision4Press platform.
Data correspond to usage on the plateform after 2015. The current usage metrics is available 48-96 hours after online publication and is updated daily on week days.
Initial download of the metrics may take a while.