Fig. 4
Download original image
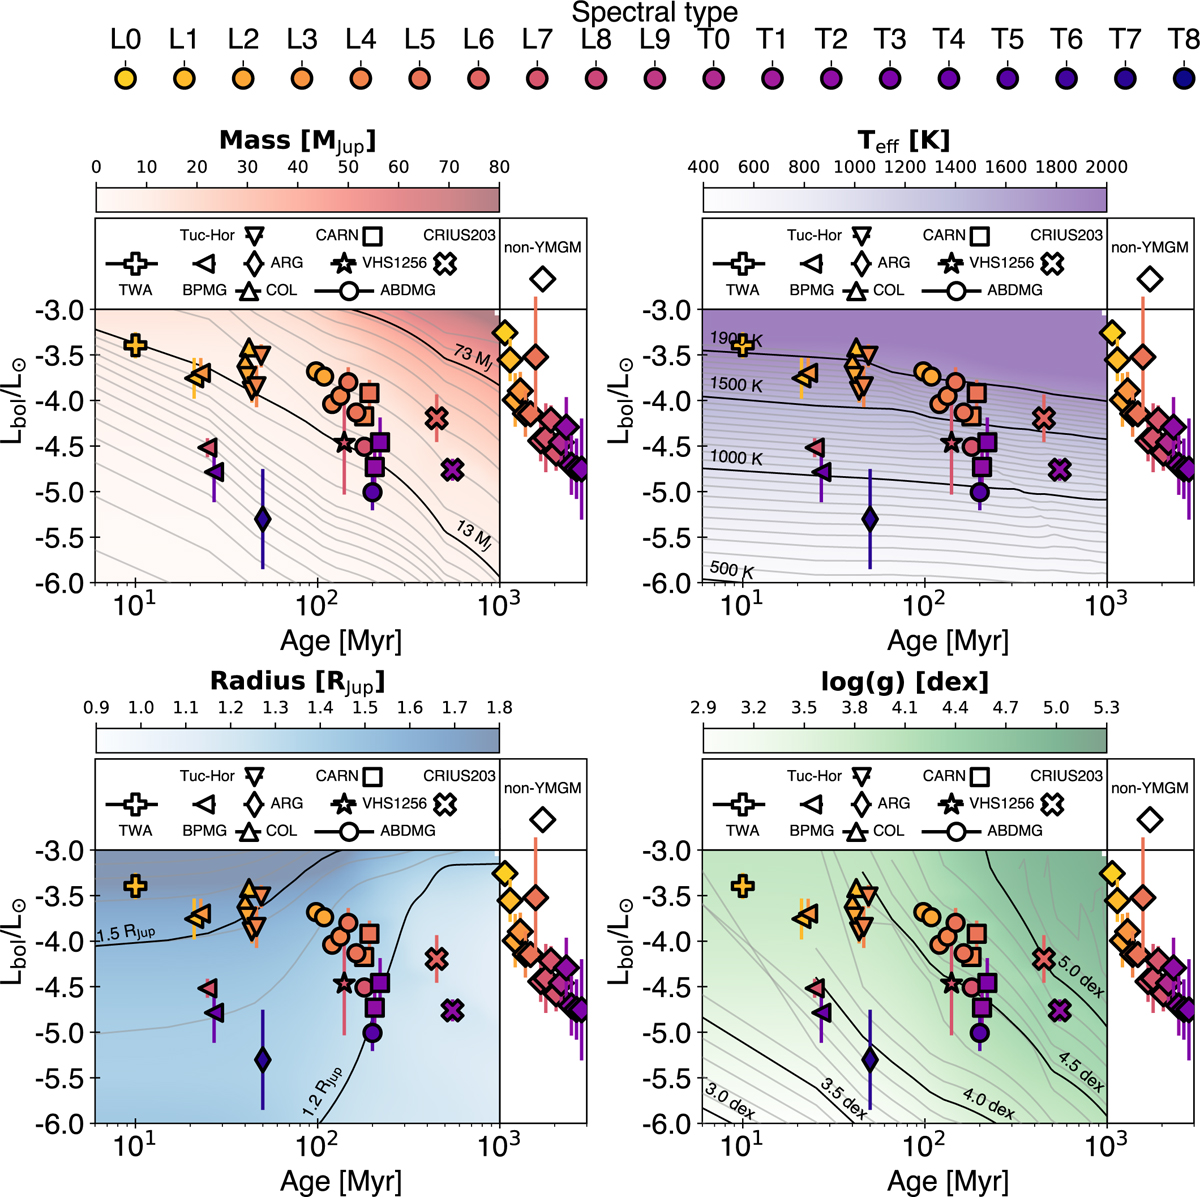
Prediction of the evolutionary model COND03 (Baraffe et al. 2003). We injected the age estimated in Section 3.2 and the Lbol calculated in Section 3.3 into the model, which we interpolated linearly to estimate the mass (top-left panel, red background), Teff (top-right panel, purple background), radius (bottom-left panel, blue background), and log(g) (bottom-right panel, green background). The non-YMGM objects, for which we do not have an age estimate, are plotted on the right side of each panel. For each parameter, we also display its variation as a function of Lbol and age (color bar and solid gray and black lines). The shape of each X-SHYNE dot represents its membership, while its color corresponds to its spectral type. To improve the clarity of the plot, objects that share the same age have been evenly distributed within a range corresponding to the error bars of that age.
Current usage metrics show cumulative count of Article Views (full-text article views including HTML views, PDF and ePub downloads, according to the available data) and Abstracts Views on Vision4Press platform.
Data correspond to usage on the plateform after 2015. The current usage metrics is available 48-96 hours after online publication and is updated daily on week days.
Initial download of the metrics may take a while.