Fig. 6
Download original image
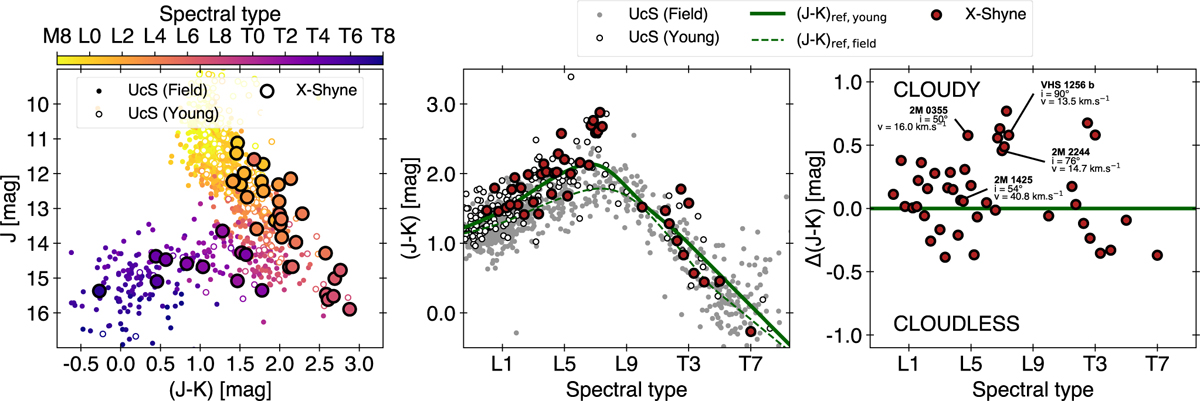
Process used to calculate the photometric anomaly Δ(J-K). Left: Color-magnitude diagram of the L-T transition. We recalculated the J and K magnitudes for all targets from our X-Shooter spectra and compared them with objects from the UltraCoolSheet library. Center: We calculated (J–K) for each object and plotted it as a function of spectral type. The mean values for field and young objects from the UltraCoolSheet library are shown with dashed and solid green lines, respectively. Right: Δ(J-K) calculated as the offset from the mean (J-K) of young objects with the same spectral type. The four X-SHYNE objects for which rotational velocity and viewing angle measurements are available are highlighted. To improve the clarity of the plot, objects sharing the same spectral type have been evenly distributed within a range corresponding to their spectral type ±1.
Current usage metrics show cumulative count of Article Views (full-text article views including HTML views, PDF and ePub downloads, according to the available data) and Abstracts Views on Vision4Press platform.
Data correspond to usage on the plateform after 2015. The current usage metrics is available 48-96 hours after online publication and is updated daily on week days.
Initial download of the metrics may take a while.