Fig. 7
Download original image
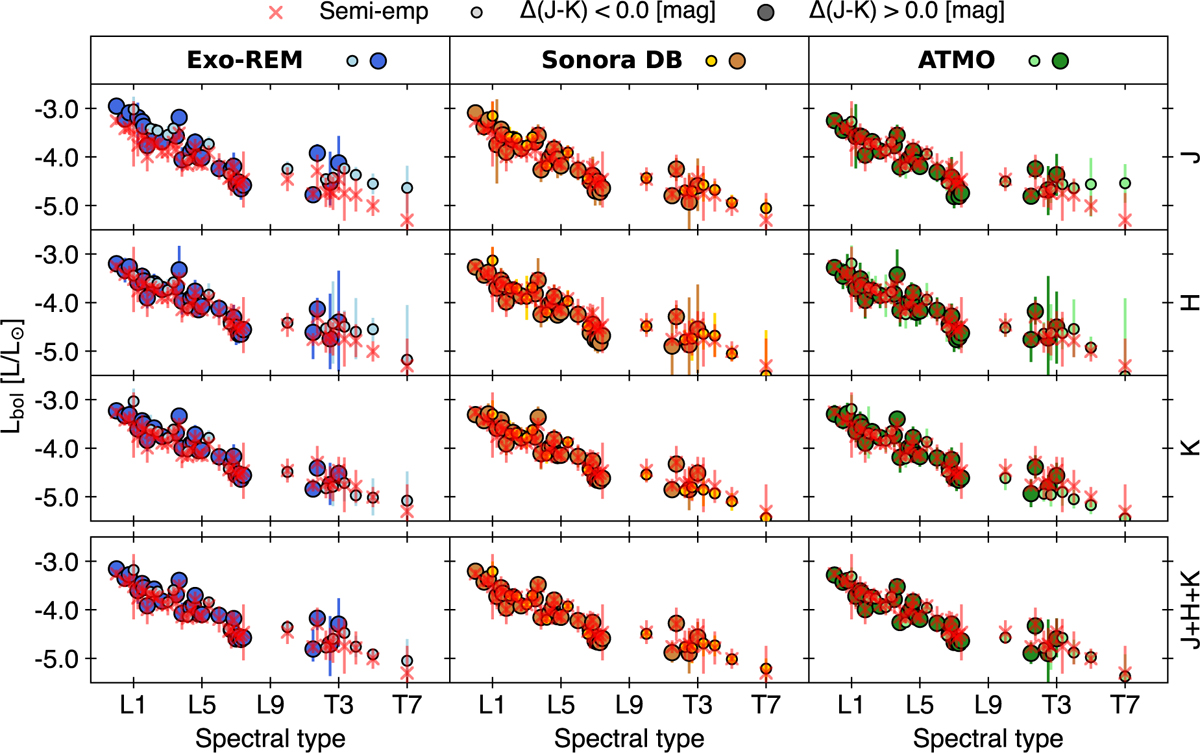
Lbol estimated from each model grid and for each spectral range using the Stefan–Boltzmann law, based on the estimated Teff (see Figure 8) and radius (see Figure 9). Objects with a negative color anomaly are represented by small light dots, while those with a positive color anomaly are shown as large deep dots. The Lbol values derived from the reconstructed SED (see Section 3.3) are indicated by red crosses.
Current usage metrics show cumulative count of Article Views (full-text article views including HTML views, PDF and ePub downloads, according to the available data) and Abstracts Views on Vision4Press platform.
Data correspond to usage on the plateform after 2015. The current usage metrics is available 48-96 hours after online publication and is updated daily on week days.
Initial download of the metrics may take a while.