Fig. 1
Download original image
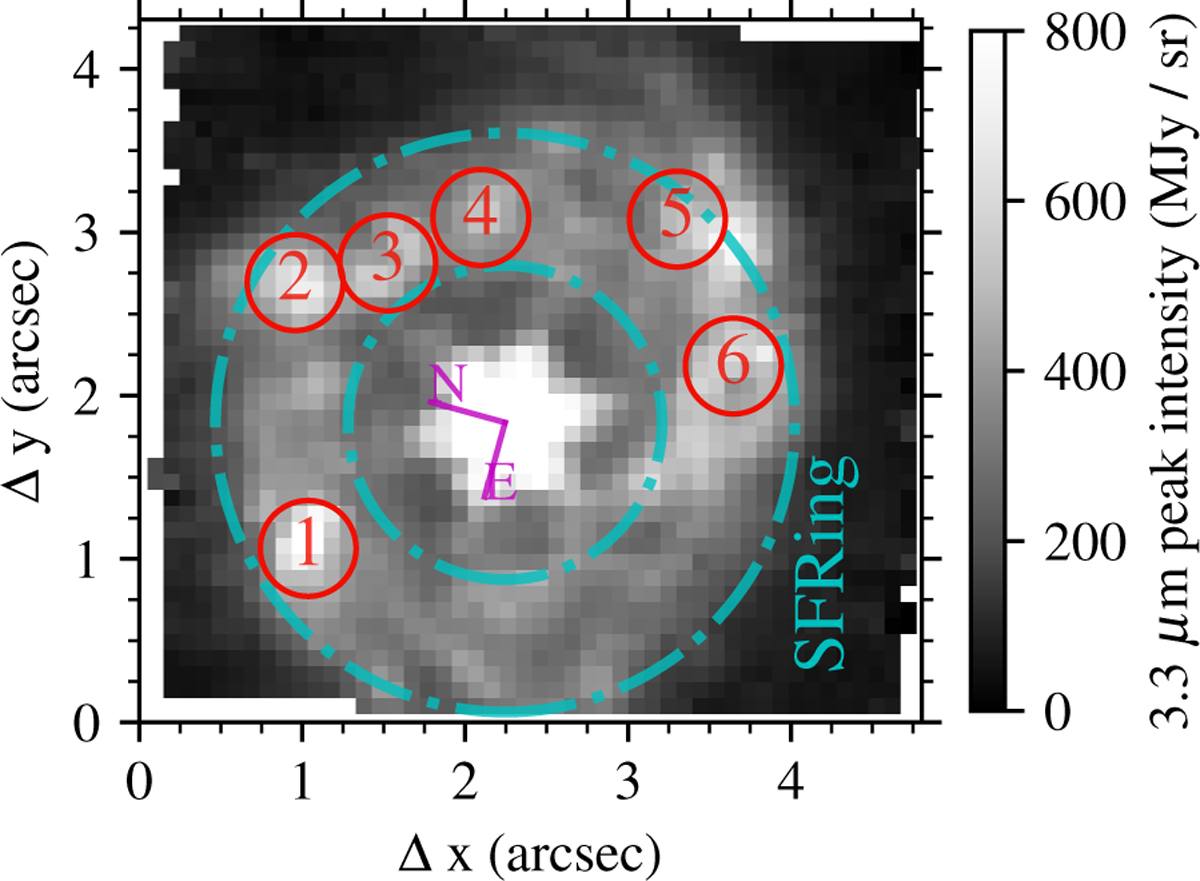
Apertures used for extracting NGC7469 spectra from NIRSpec and MIRI IFU data cubes. The background image is a single NIRSpec slice near the peak of the 3.3 μm band (3.343 μm due to redshift), and the north and east indicators at the center indicate the orientation. The red circles (radius of 0.3″) represent the SF1 to SF6 apertures as numbered. The cyan circles indicate the circular annulus region used to extract the average spectrum of the SFRing surrounding the AGN.
Current usage metrics show cumulative count of Article Views (full-text article views including HTML views, PDF and ePub downloads, according to the available data) and Abstracts Views on Vision4Press platform.
Data correspond to usage on the plateform after 2015. The current usage metrics is available 48-96 hours after online publication and is updated daily on week days.
Initial download of the metrics may take a while.