Fig. B.1
Download original image
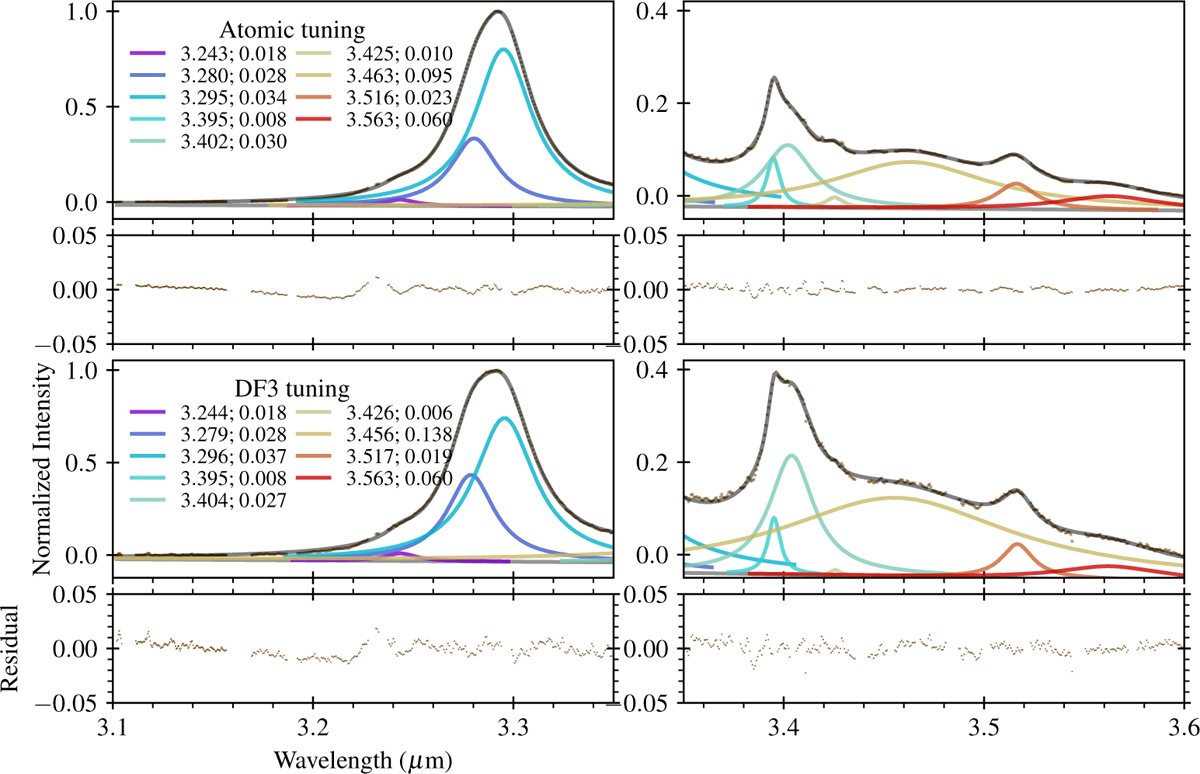
Tuning results for 3.3-3.6 μm complex based on normalized atomic PDR and DF3 Orion Bar template spectra. The rainbow-colored curves show the individual components, and to prevent crowding this visualization, their wings are only shown within three FWHM of their centers. The gray curve is their sum, and the brown dots show the normalized spectra used for the fit (see Sect. B.3). The panels at the bottom of each quadrant show the absolute residuals (data – model). The numbers in the legend indicate the central wavelengths and FWHM of the individual components. Parts of the model can be slightly negative, since a linear term was added to the fits (Sect. B.1).
Current usage metrics show cumulative count of Article Views (full-text article views including HTML views, PDF and ePub downloads, according to the available data) and Abstracts Views on Vision4Press platform.
Data correspond to usage on the plateform after 2015. The current usage metrics is available 48-96 hours after online publication and is updated daily on week days.
Initial download of the metrics may take a while.