Fig. 5
Download original image
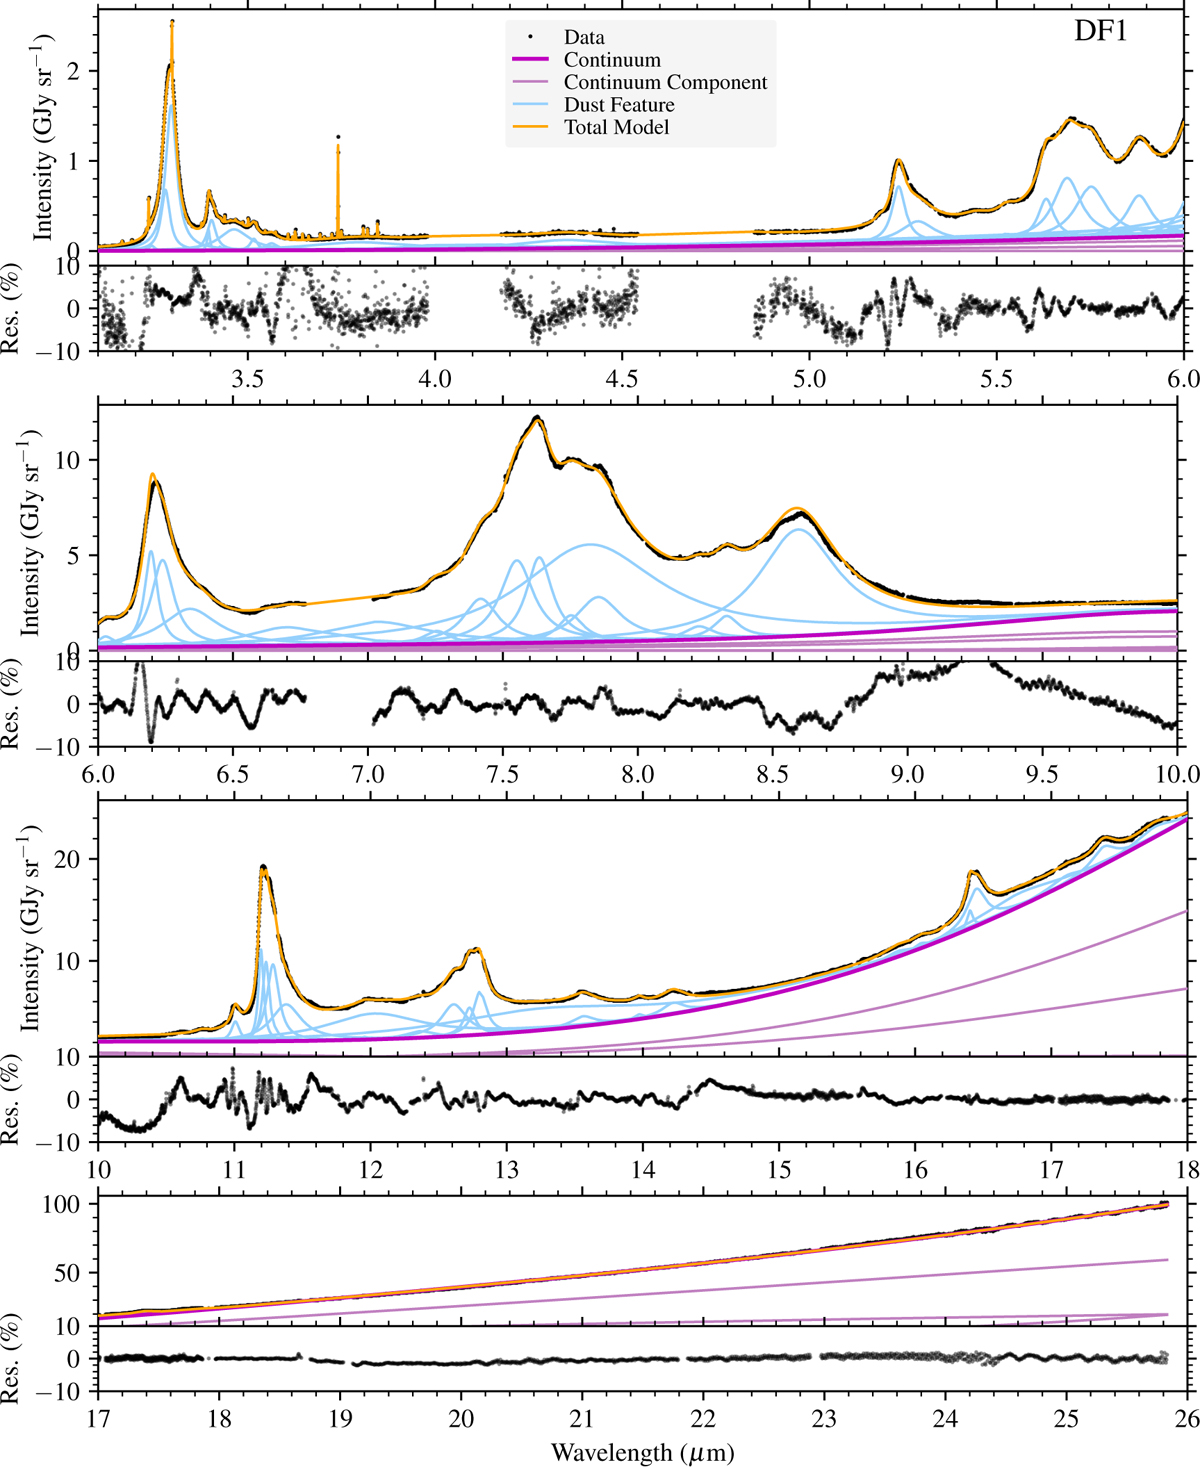
Illustration of fit with PAHFIT and the PDR pack applied to the Orion Bar DF1 template spectrum over the 3.1–26 μm wavelength range using the alternate continuum model. The gaps in the data are wavelength sections that were omitted (Sect. 2.3). The lower part of each panel shows the fractional residuals. The fits to narrow lines in the 3.1–3.8 μm range are included in the total model curve but not shown individually. The uncertainties on the data are not shown as they are very small, and the residuals are outside the 1σ range for most of the data points.
Current usage metrics show cumulative count of Article Views (full-text article views including HTML views, PDF and ePub downloads, according to the available data) and Abstracts Views on Vision4Press platform.
Data correspond to usage on the plateform after 2015. The current usage metrics is available 48-96 hours after online publication and is updated daily on week days.
Initial download of the metrics may take a while.