Open Access
Fig. 4
Download original image
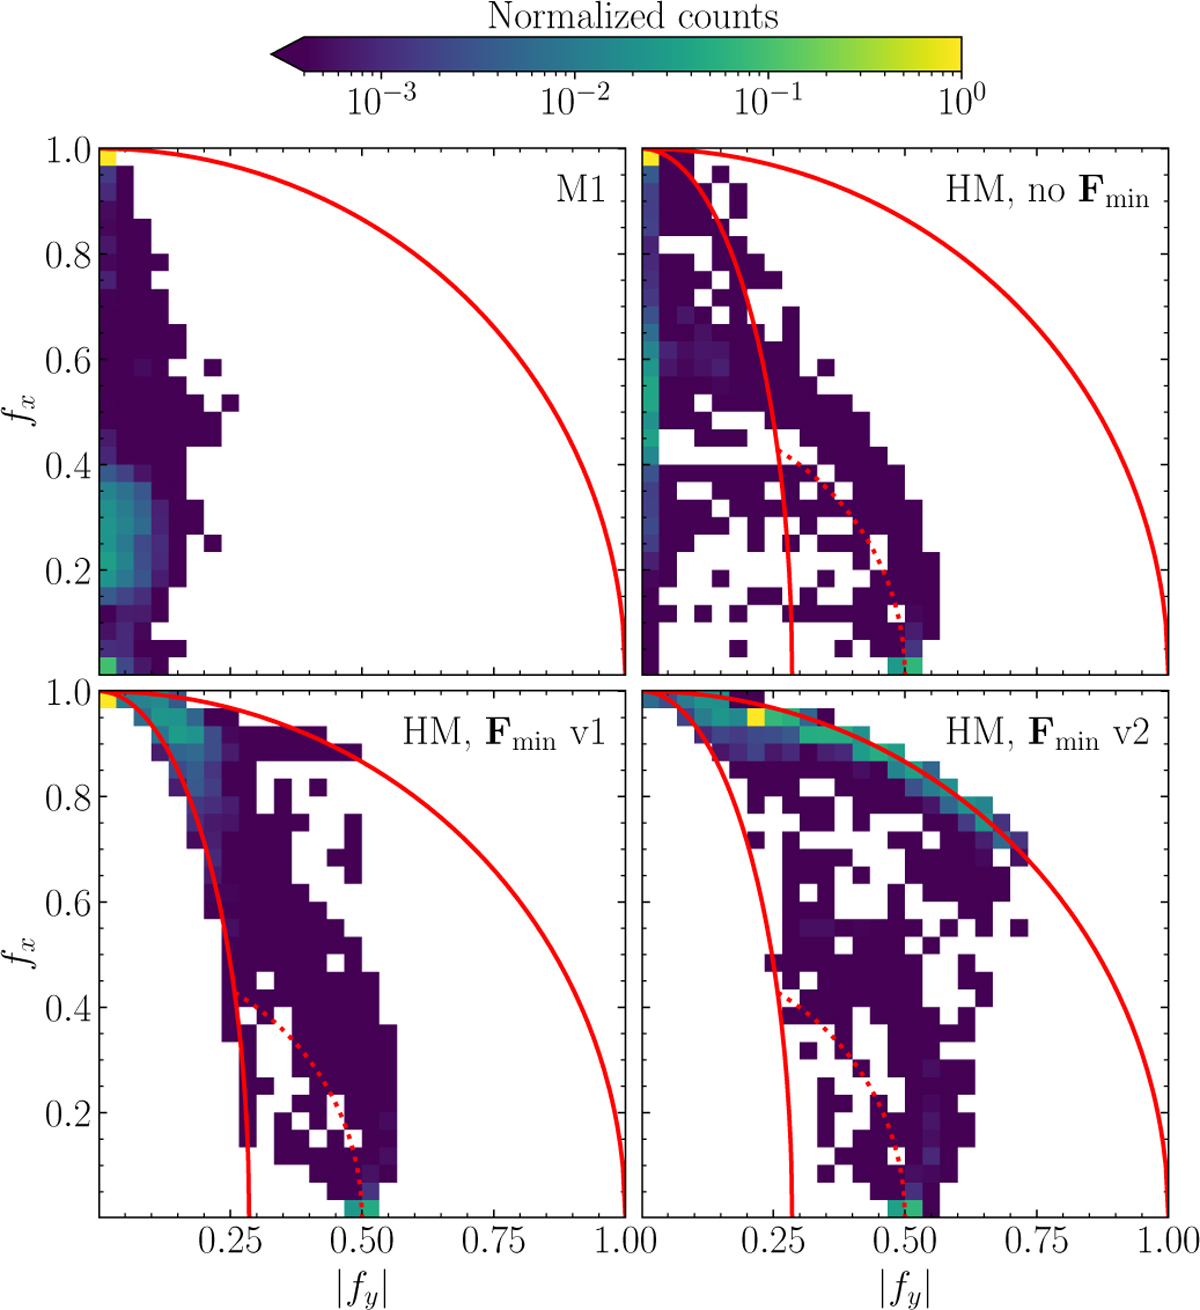
Frequency of (|fy|, fx) values in each computational cell in the shadow tests shown in Fig. 3, normalized to a maximum of 1. The reduced fluxes are defined as (fx, fy)=F/E and F±/E±in the M1 and HM closures, respectively. Solid lines indicate the limits given by Eqs. (21) and (22), while dotted lines correspond to f = 1/2.
Current usage metrics show cumulative count of Article Views (full-text article views including HTML views, PDF and ePub downloads, according to the available data) and Abstracts Views on Vision4Press platform.
Data correspond to usage on the plateform after 2015. The current usage metrics is available 48-96 hours after online publication and is updated daily on week days.
Initial download of the metrics may take a while.