Fig. 6.
Download original image
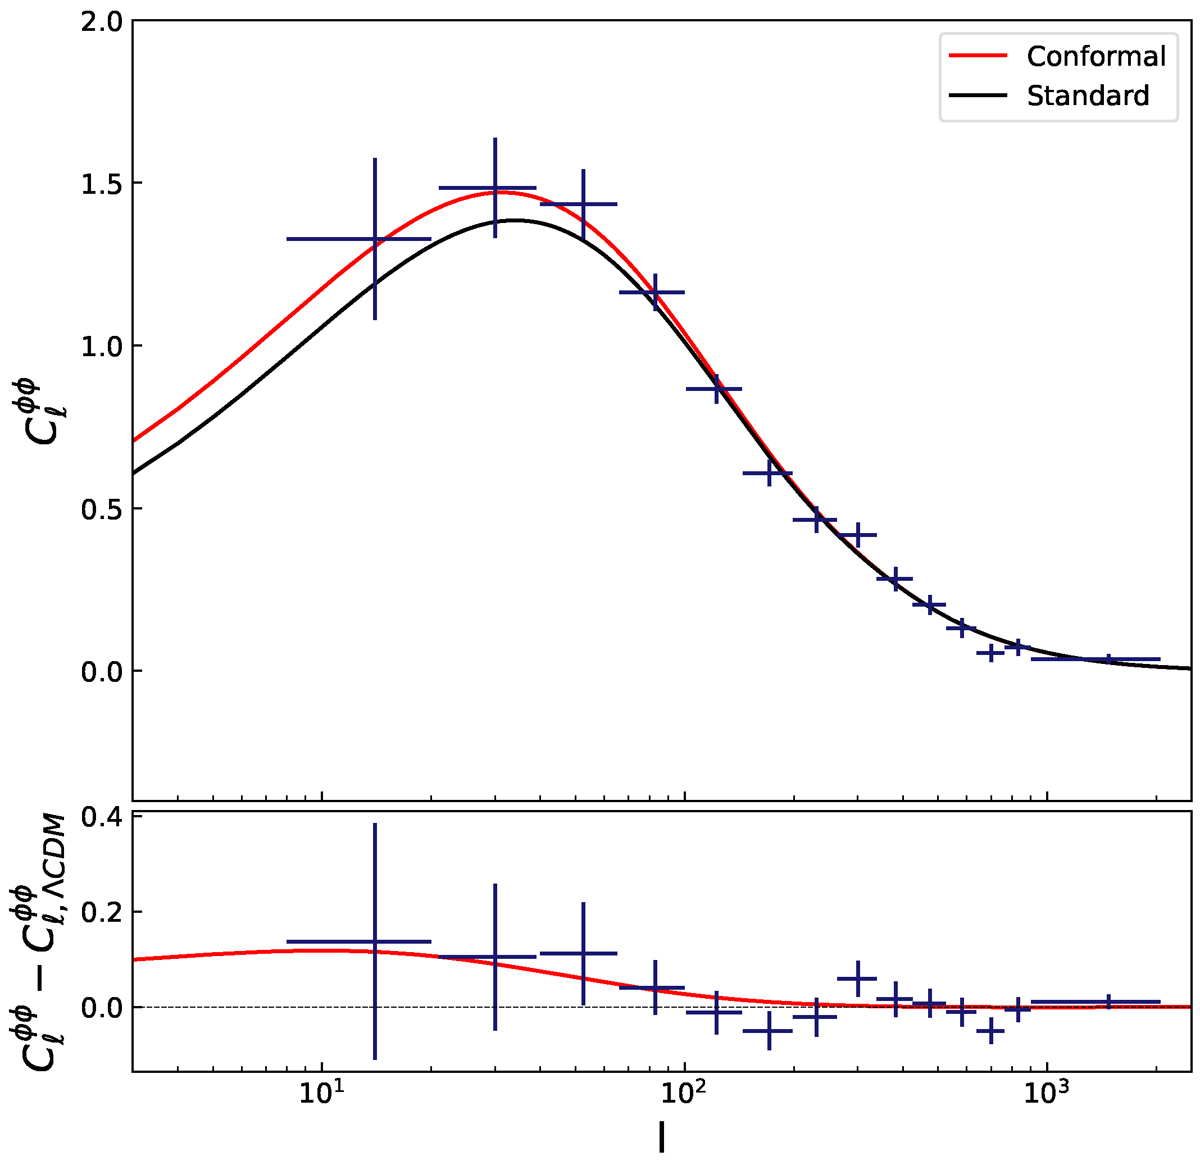
Top panel: Lensing potential power spectrum obtained with the standard model using Planck 2018 best-fit values (black line) and with the CSF model using the best-fit values obtained fitting only the CMB (red line). The red points are the values measured by Planck 2018 (Planck Collaboration VI 2020). Bottom panel: Difference between the CSF and standard model.
Current usage metrics show cumulative count of Article Views (full-text article views including HTML views, PDF and ePub downloads, according to the available data) and Abstracts Views on Vision4Press platform.
Data correspond to usage on the plateform after 2015. The current usage metrics is available 48-96 hours after online publication and is updated daily on week days.
Initial download of the metrics may take a while.