Fig. 6
Download original image
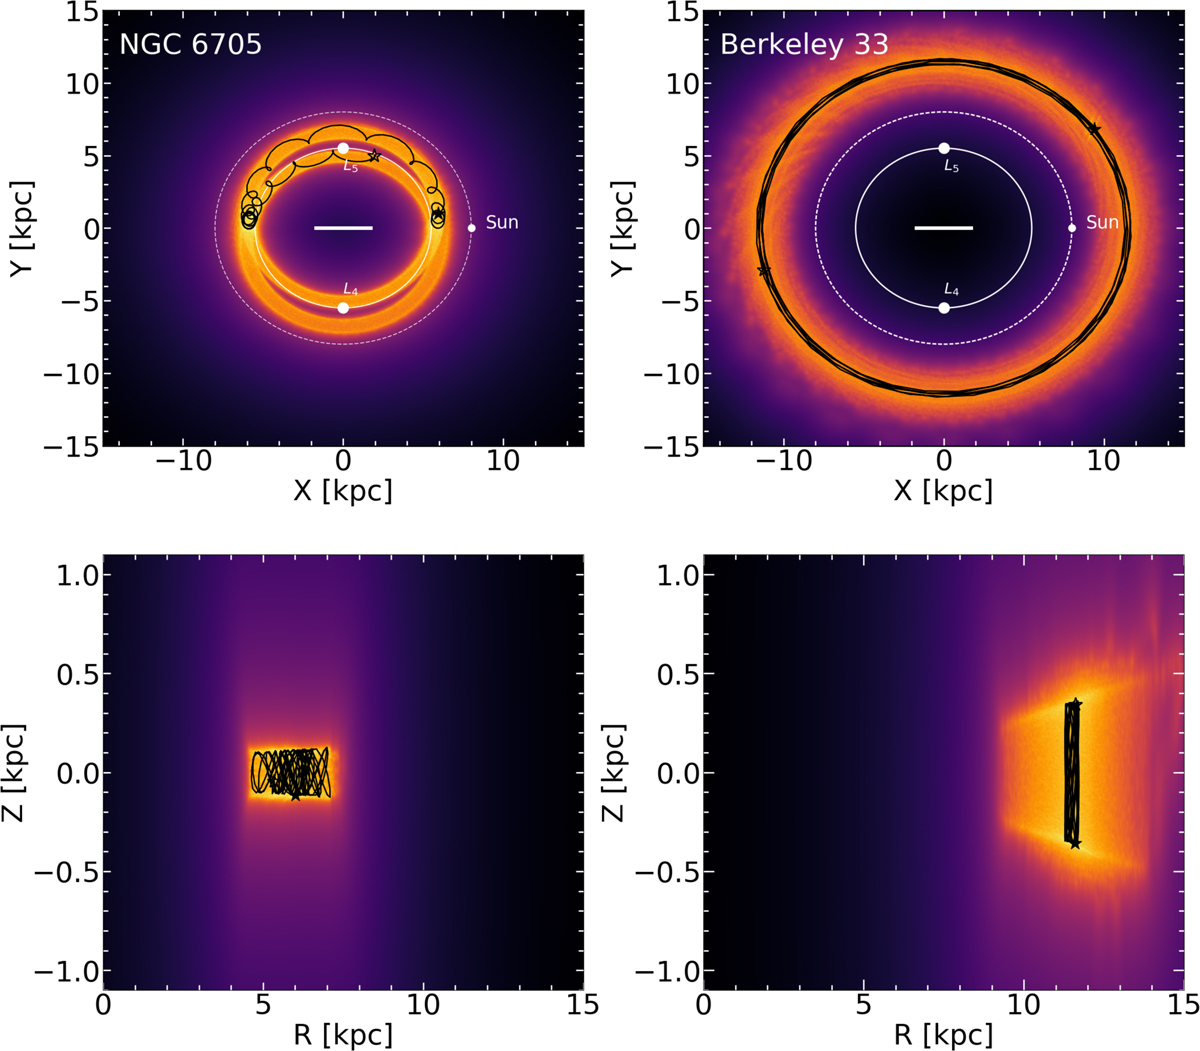
Ensemble of half a million orbits in the frame corotating with the bar for two selected OCs, projected on the equatorial (top) and meridional (bottom) GPs in the non-inertial reference frame with a bar pattern speed of 41 kms−1 kpc−1, and time-integrated backward over 2 Gyr. Yellow and orange correspond to more probable regions of the space, which are most frequently crossed by the simulated orbits. The inner solid and outer dashed white circles in the top panels show the locations of the CR and solar orbit, respectively, while the white dots mark the positions of the Lagrange points of the Galactic bar, L4 and L5, and the current Sun’s position. The horizontal solid white line shows the extension of the bar (Rc ∼ 3.4 kpc; Robin et al. 2012) in our model. The solid black line shows the orbits of the selected OCs from the observables without error bars. The black-filled and unfilled star symbols indicate the initial and final positions of the OCs in our simulations, respectively.
Current usage metrics show cumulative count of Article Views (full-text article views including HTML views, PDF and ePub downloads, according to the available data) and Abstracts Views on Vision4Press platform.
Data correspond to usage on the plateform after 2015. The current usage metrics is available 48-96 hours after online publication and is updated daily on week days.
Initial download of the metrics may take a while.