Fig. 8
Download original image
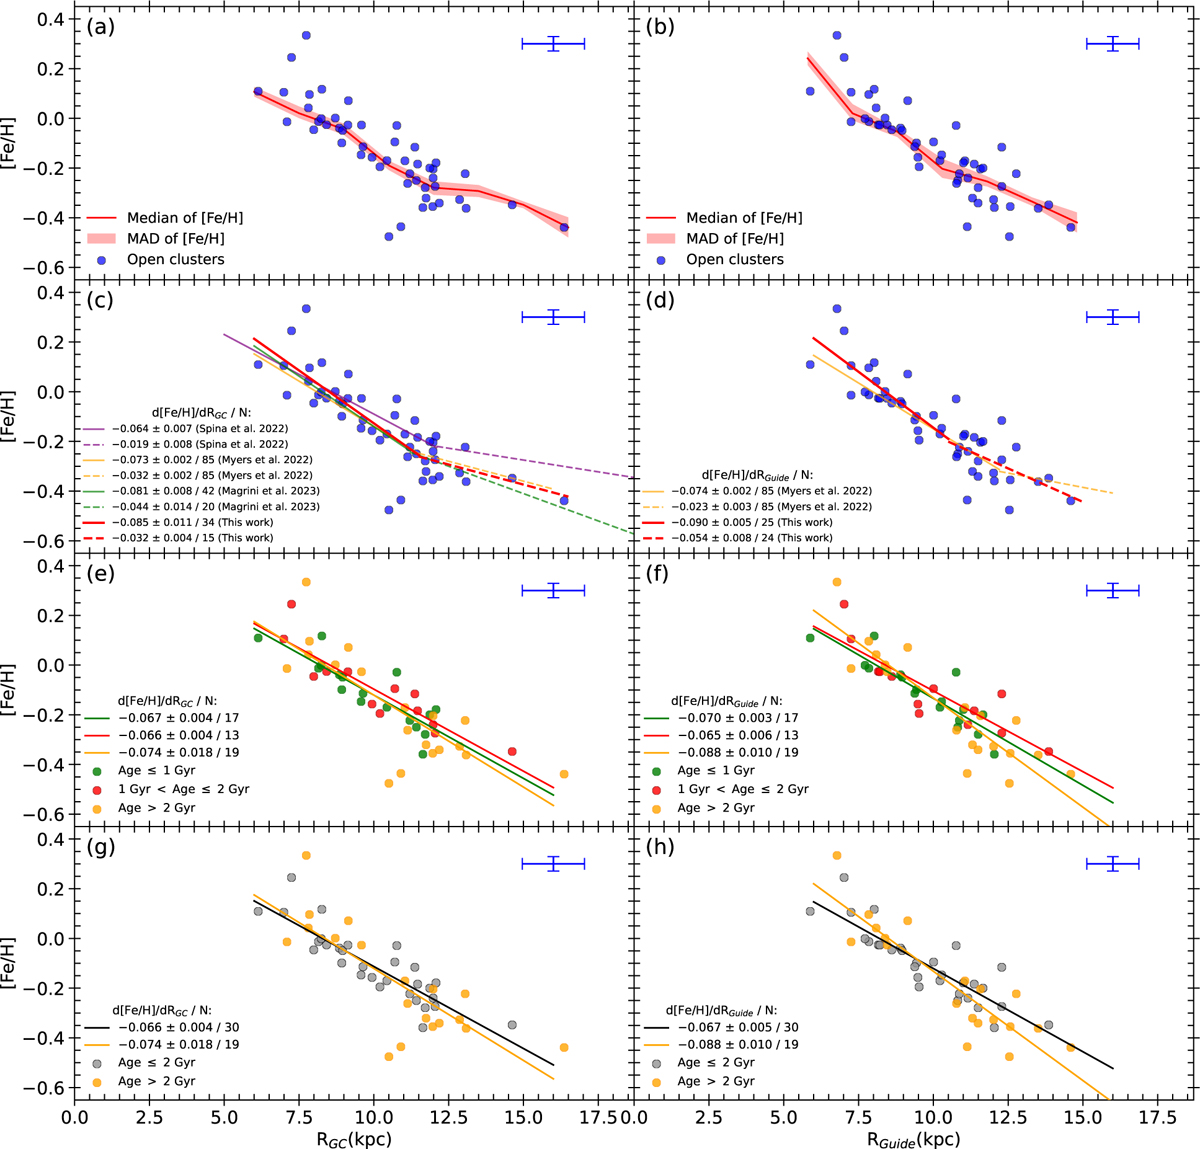
Metallicity gradient, where RGC is the projected Galactocentric distance and the RGuide is obtained from the average between apocenter and pericenter. Blue circles represent the 49 OCs of this work. In panels a and b, the red lines represent the median of [Fe/H] for each 1.5 kpc range: 6–16.5 kpcs (panel a) and 6–15 kpcs (panel b); the pink strip represents the median absolute deviation (MAD) of [Fe/H]. In panels c and d, the red lines were obtained with two linear regressions: in panel c, the first in the 6–11.5 kpc interval (solid line) and the second in the 11.5–16.5 kpc interval (dashed line); in panel d, the first in the 6–10.5 kpc interval (solid line) and the second in the 10.5–15 kpc interval (dashed line). In panels c and d, we compare our results with the Spina et al. (2022, purple lines), Myers et al. (2022, orange lines), and Magrini et al. (2023, green lines) results. Panels e and f separate the OCs by age: 17 OCs aged less than 1 Gyr (green circles), 13 OCs with ages between 1 and 2 Gyr (red circles), and 19 OCs aged greater than 2 Gyr (orange circles). The lines in panels e and f are the linear regressions for each of these groups of OCs: green line (OCs aged less than 1 Gyr), red line (OCs with ages between 1 and 2 Gyr), and orange line (OCs aged greater than 2 Gyr). In panels g and h, all OCs of ages under 2 Gyr are represented by gray circles, while the black line is the linear regression of these OCs. The OCs ages were obtained from Cantat-Gaudin & Anders (2020) and are aged 0.02 to 4.00 Gyr. The lines (linear regressions) this work in panels c–h were determined with the sklearn.linear_model package in Python (Pedregosa et al. 2011). Ages were obtained from Cantat-Gaudin & Anders (2020).
Current usage metrics show cumulative count of Article Views (full-text article views including HTML views, PDF and ePub downloads, according to the available data) and Abstracts Views on Vision4Press platform.
Data correspond to usage on the plateform after 2015. The current usage metrics is available 48-96 hours after online publication and is updated daily on week days.
Initial download of the metrics may take a while.