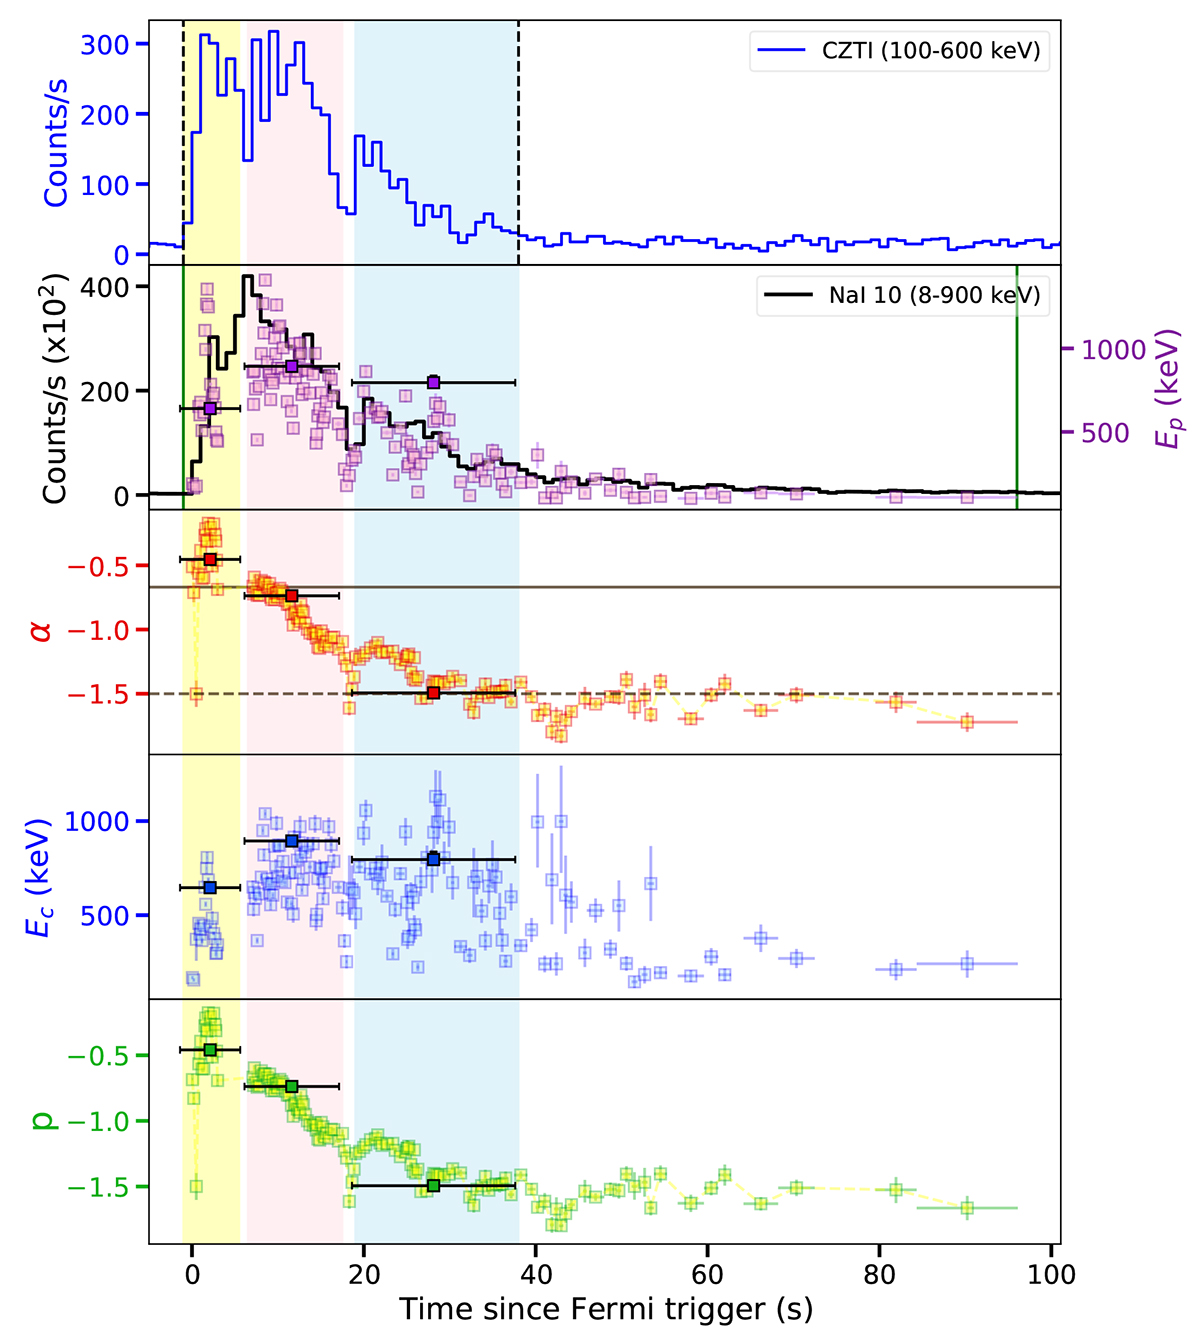
Fig. 1.
Download original image
Evolution of different spectral parameters from our time-resolved spectral fits. The first panel shows the Compton light curve of CZTI data in the 100−600 keV energy range, with the black dashed line indicating the burst interval determined using the Bayesian block technique. The second panel illustrates the light curve from the NaI 10 detector (black), and here the green solid lines depict the burst interval of Fermi GBM using the Bayesian block technique. The second through fifth panels illustrate the temporal evolution of spectral parameters throughout the burst (band function parameters: peak energy, Ep, and low-energy spectral index, α; and CPL parameters: cutoff energy, Ec, and power-law index, p). Spectral parameters derived from KW data are shown as dark markers with black error bars, while the finer time-bin spectra modeled using Fermi data are displayed as lighter background points. In the third panel, the solid and dashed brown lines indicate the synchrotron limits for slow-cooling (−2/3) and fast-cooling (−3/2) scenarios, respectively. Shaded regions highlight the time-resolved intervals used for the polarization analysis.
Current usage metrics show cumulative count of Article Views (full-text article views including HTML views, PDF and ePub downloads, according to the available data) and Abstracts Views on Vision4Press platform.
Data correspond to usage on the plateform after 2015. The current usage metrics is available 48-96 hours after online publication and is updated daily on week days.
Initial download of the metrics may take a while.