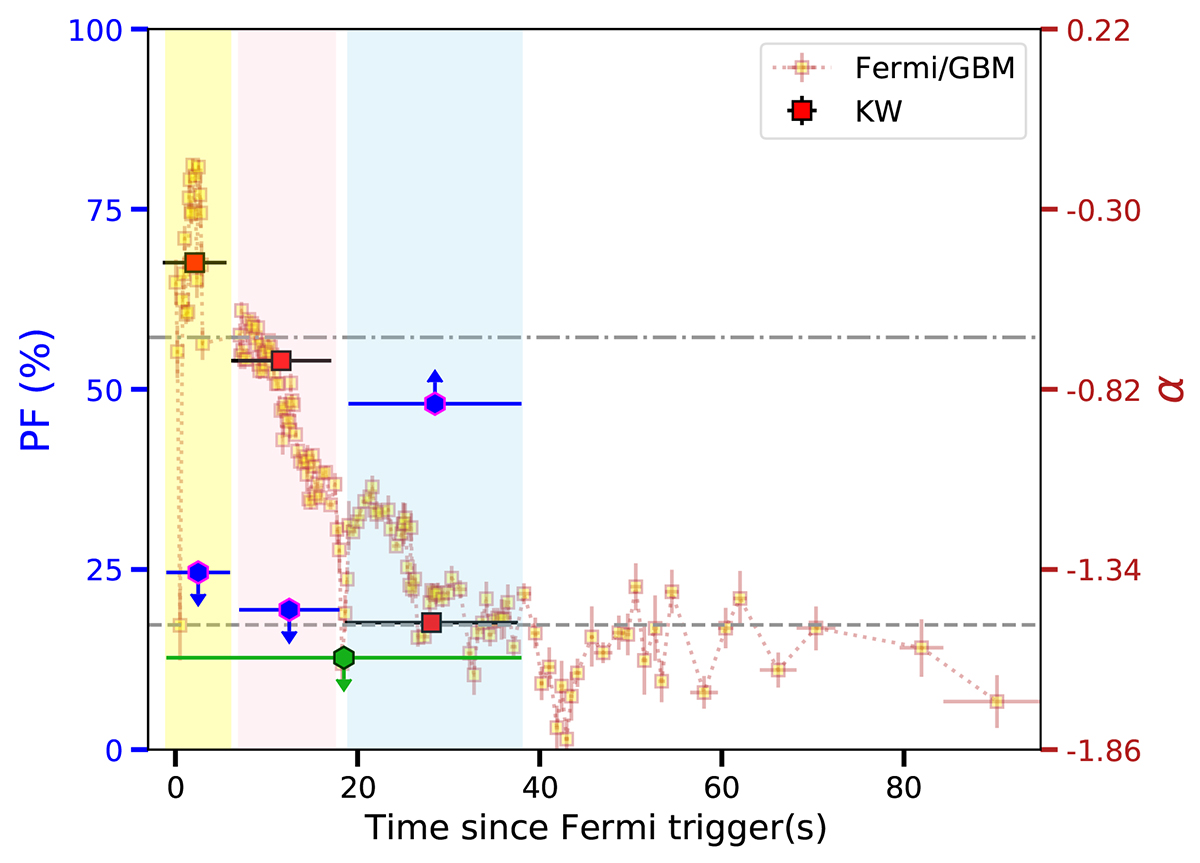
Fig. 2.
Download original image
Time-averaged and time-resolved spectro-polarimetric analysis of GRB 230307A. The plot illustrates the evolution of the PF in 100−600 keV during the time-resolved (blue hexagon markers) and time-integrated (green hexagon marker) intervals of GRB 230307A. Three distinct time-resolved regions are highlighted with yellow, red, and blue shaded areas. The right vertical axis presents the corresponding variation in the low-energy spectral index (α) derived from the band function fits. The spectral indices obtained using time-resolved spectral analysis of Fermi data are represented by orange squares, while those from Konus-Wind data (for each region) are denoted by red squares. The grey dashed and dot-dashed lines indicate the theoretical bounds for the fast-cooling and slow-cooling synchrotron emission regimes, respectively, providing a reference for evaluating the observed spectral behavior.
Current usage metrics show cumulative count of Article Views (full-text article views including HTML views, PDF and ePub downloads, according to the available data) and Abstracts Views on Vision4Press platform.
Data correspond to usage on the plateform after 2015. The current usage metrics is available 48-96 hours after online publication and is updated daily on week days.
Initial download of the metrics may take a while.